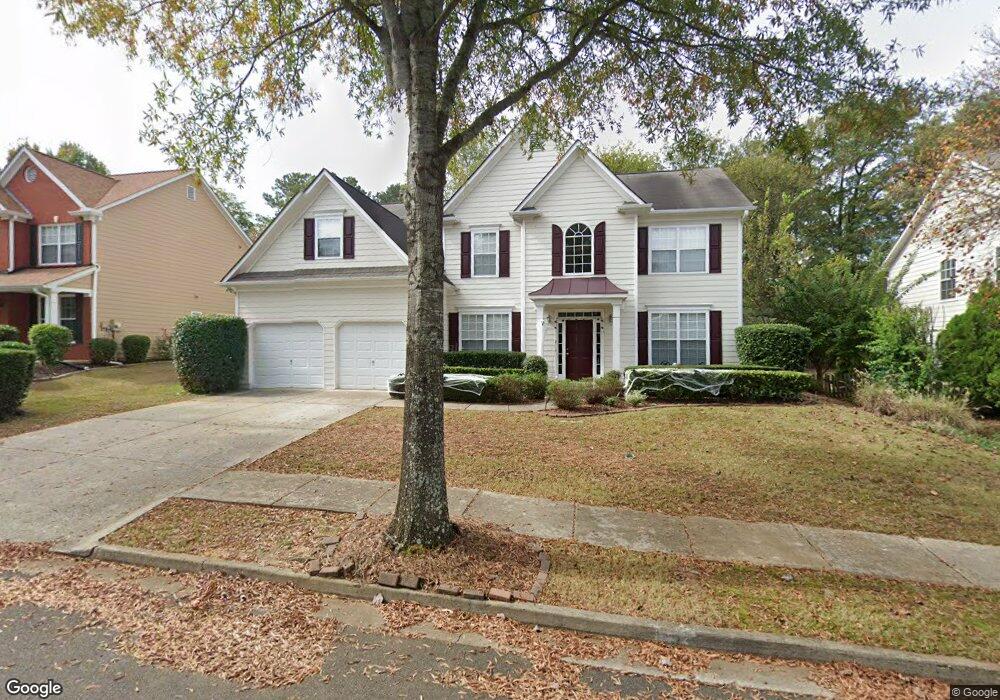
386 Windsong Way Woodstock, GA 30188
Estimated Value: $592,688 - $617,000
5
Beds
3
Baths
2,711
Sq Ft
$223/Sq Ft
Est. Value
About This Home
This home is located at 386 Windsong Way, Woodstock, GA 30188 and is currently estimated at $604,844, approximately $223 per square foot. 386 Windsong Way is a home located in Cherokee County with nearby schools including Woodstock Elementary School, Woodstock Middle School, and Woodstock High School.
Ownership History
Date
Name
Owned For
Owner Type
Purchase Details
Closed on
Sep 24, 2021
Sold by
Lopez Lourdes
Bought by
Bravo Ana P
Current Estimated Value
Home Financials for this Owner
Home Financials are based on the most recent Mortgage that was taken out on this home.
Original Mortgage
$360,000
Outstanding Balance
$327,573
Interest Rate
2.8%
Mortgage Type
New Conventional
Estimated Equity
$277,271
Purchase Details
Closed on
Jul 9, 2020
Sold by
Nova L Properties
Bought by
Lopez Lourdes
Purchase Details
Closed on
Feb 5, 2018
Sold by
Mora Jose A
Bought by
Lopez Lourdes
Purchase Details
Closed on
Dec 17, 2008
Sold by
Lopez Lourdes
Bought by
Mora Jose A
Purchase Details
Closed on
Jan 18, 2008
Sold by
Strock Brad L and Strock Andrea M
Bought by
Lopez Lourdes and Mora Jose
Purchase Details
Closed on
Mar 21, 2002
Sold by
Mccar Dev Corp
Bought by
Strock Brad L and Strock Andrea M
Home Financials for this Owner
Home Financials are based on the most recent Mortgage that was taken out on this home.
Original Mortgage
$117,500
Interest Rate
6.85%
Create a Home Valuation Report for This Property
The Home Valuation Report is an in-depth analysis detailing your home's value as well as a comparison with similar homes in the area
Home Values in the Area
Average Home Value in this Area
Purchase History
| Date | Buyer | Sale Price | Title Company |
|---|---|---|---|
| Bravo Ana P | $450,000 | -- | |
| Lopez Lourdes | -- | -- | |
| Lopez Lourdes | -- | -- | |
| Mora Jose A | -- | -- | |
| Lopez Lourdes | $232,500 | -- | |
| Strock Brad L | $205,300 | -- |
Source: Public Records
Mortgage History
| Date | Status | Borrower | Loan Amount |
|---|---|---|---|
| Open | Bravo Ana P | $360,000 | |
| Previous Owner | Strock Brad L | $117,500 |
Source: Public Records
Tax History Compared to Growth
Tax History
| Year | Tax Paid | Tax Assessment Tax Assessment Total Assessment is a certain percentage of the fair market value that is determined by local assessors to be the total taxable value of land and additions on the property. | Land | Improvement |
|---|---|---|---|---|
| 2024 | $5,984 | $211,076 | $44,800 | $166,276 |
| 2023 | $1,145 | $213,200 | $44,800 | $168,400 |
| 2022 | $4,762 | $162,520 | $40,000 | $122,520 |
| 2021 | $3,605 | $143,640 | $32,000 | $111,640 |
| 2020 | $3,271 | $130,200 | $22,000 | $108,200 |
| 2019 | $2,965 | $117,920 | $22,000 | $95,920 |
| 2018 | $2,696 | $106,480 | $22,000 | $84,480 |
| 2017 | $2,382 | $255,000 | $22,000 | $80,000 |
| 2016 | $2,382 | $231,400 | $20,000 | $72,560 |
| 2015 | $2,225 | $214,200 | $20,000 | $65,680 |
| 2014 | $2,055 | $197,400 | $20,000 | $58,960 |
Source: Public Records
Map
Nearby Homes
- 170 Fowler St Unit 100
- 170 Fowler St Unit 200
- 191 Fowler St
- 108 Barnesdale Terrace
- 110 Barnesdale Terrace
- 360 Chambers St Unit 155
- 360 Chambers St Unit 456
- 360 Chambers St Unit 408
- 360 Chambers St Unit 407
- 360 Chambers St Unit 210
- 360 Chambers St Unit 402
- 360 Chambers St Unit 405
- 360 Chambers St Unit 301
- 308 Chardonnay Way
- The Barrington Plan at South on Main
- 147 Hubbard Rd
- 719 Hammond Dr
- 202 Dawson Dr
- 388 Windsong Way
- 384 Windsong Way
- 390 Windsong Way
- 382 Windsong Way
- 371 Windsong Way
- 369 Windsong Way
- 373 Windsong Way
- 392 Windsong Way
- 367 Windsong Way
- 380 Windsong Way
- 363 Windsong Way
- 378 Windsong Way
- 394 Windsong Way
- 9015 Main St
- 377 Windsong Way
- 8859 Main St Unit 2
- 8859 Main St Unit 4
- 8859 Main St Unit 3
- 365 Windsong Way
- 376 Windsong Way