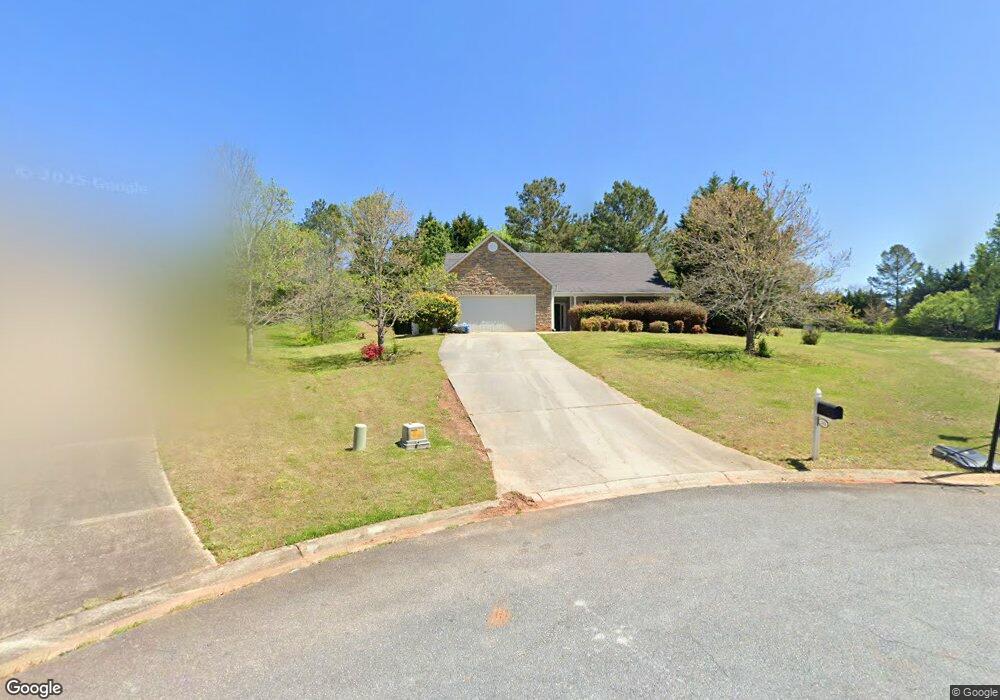
386 Winslow Ct Unit 2 Bethlehem, GA 30620
Estimated Value: $300,000 - $334,000
3
Beds
2
Baths
1,690
Sq Ft
$189/Sq Ft
Est. Value
About This Home
This home is located at 386 Winslow Ct Unit 2, Bethlehem, GA 30620 and is currently estimated at $319,725, approximately $189 per square foot. 386 Winslow Ct Unit 2 is a home located in Barrow County with nearby schools including Bethlehem Elementary School, Haymon-Morris Middle School, and Apalachee High School.
Ownership History
Date
Name
Owned For
Owner Type
Purchase Details
Closed on
Jan 17, 2014
Sold by
Dunn Dewey G
Bought by
Ih3 Property Georgia Lp
Current Estimated Value
Purchase Details
Closed on
Oct 27, 2006
Sold by
Flanders Matthew J and Flanders Tiffany H
Bought by
Dunn Dewey G and Dunn Ann B
Home Financials for this Owner
Home Financials are based on the most recent Mortgage that was taken out on this home.
Original Mortgage
$132,300
Interest Rate
6.39%
Mortgage Type
New Conventional
Purchase Details
Closed on
Oct 30, 2003
Sold by
Meridian Homes Of Georgia
Bought by
Flanders Tiffany H And
Purchase Details
Closed on
Jun 24, 2003
Sold by
Millstone Development
Bought by
Meridian Homes Of Georgia
Purchase Details
Closed on
Jan 3, 2001
Bought by
Millstone Development
Create a Home Valuation Report for This Property
The Home Valuation Report is an in-depth analysis detailing your home's value as well as a comparison with similar homes in the area
Home Values in the Area
Average Home Value in this Area
Purchase History
| Date | Buyer | Sale Price | Title Company |
|---|---|---|---|
| Ih3 Property Georgia Lp | $96,550 | -- | |
| Dunn Dewey G | $147,000 | -- | |
| Flanders Tiffany H And | $130,000 | -- | |
| Meridian Homes Of Georgia | $1,664,000 | -- | |
| Millstone Development | -- | -- |
Source: Public Records
Mortgage History
| Date | Status | Borrower | Loan Amount |
|---|---|---|---|
| Previous Owner | Dunn Dewey G | $132,300 |
Source: Public Records
Tax History Compared to Growth
Tax History
| Year | Tax Paid | Tax Assessment Tax Assessment Total Assessment is a certain percentage of the fair market value that is determined by local assessors to be the total taxable value of land and additions on the property. | Land | Improvement |
|---|---|---|---|---|
| 2024 | $2,131 | $81,112 | $24,000 | $57,112 |
| 2023 | $2,143 | $81,512 | $24,000 | $57,512 |
| 2022 | $2,109 | $81,512 | $24,000 | $57,512 |
| 2021 | $2,280 | $71,228 | $16,000 | $55,228 |
| 2020 | $2,074 | $64,219 | $16,000 | $48,219 |
| 2019 | $2,109 | $64,219 | $16,000 | $48,219 |
| 2018 | $1,877 | $57,272 | $13,400 | $43,872 |
| 2017 | $1,331 | $45,726 | $13,400 | $32,326 |
| 2016 | $1,518 | $46,089 | $13,400 | $32,689 |
| 2015 | $1,299 | $46,452 | $13,400 | $33,052 |
| 2014 | $1,400 | $40,569 | $7,154 | $33,415 |
| 2013 | -- | $38,932 | $7,154 | $31,778 |
Source: Public Records
Map
Nearby Homes
- 103 Camp Ct
- 384 Winslow Ct
- 763 Moss Side Dr
- 637 Sleeping Meadow Ln
- 286 Meadows Dr
- 1071 Covenant Ct
- 0 Tanners Bridge Cir Unit 10536031
- 1035 Lucienne Blvd
- 1047 Lucienne Blvd
- 840 N Cross Lane Rd
- 0 Jb Owens Unit 7552902
- 0 Jb Owens Unit 7552891
- 0 Jb Owens Unit LOT 2 - 2.09 ACRES
- 0 Jb Owens Unit LOT 3 - 2.01 ACRES
- 480 Raider Way
- 3153 Lowell Rd
- 468 Grand Oaks Ave
- 1381 Loganville Hwy
- 960 Providence Ln
- 7357 Raleigh Way