Estimated Value: $244,423 - $292,000
3
Beds
3
Baths
1,988
Sq Ft
$136/Sq Ft
Est. Value
About This Home
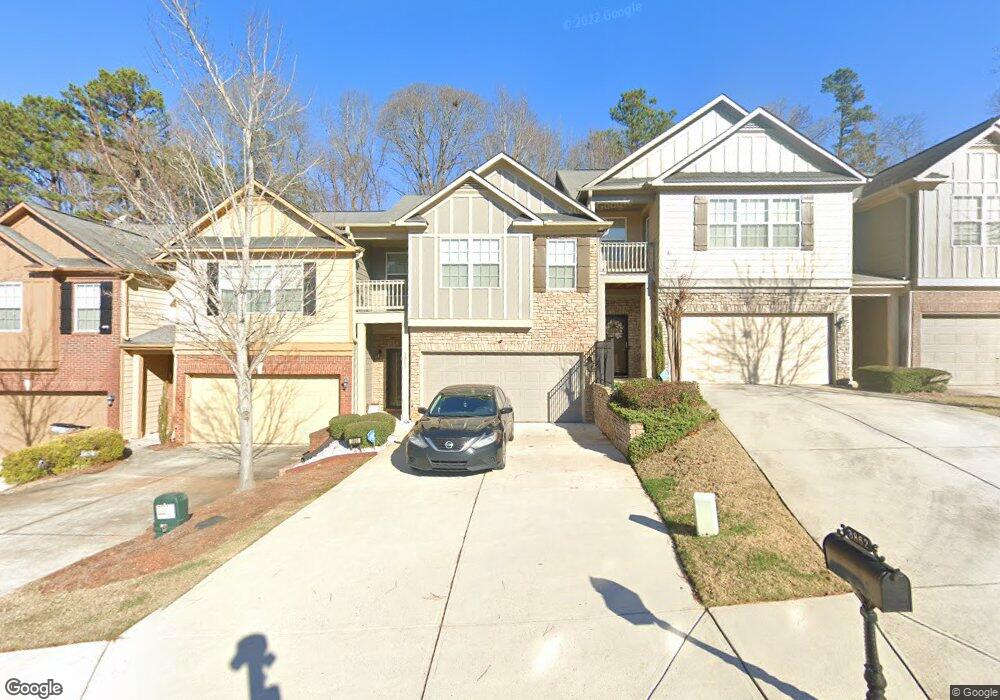
This home is located at 3860 Augustine Place Unit 36, Rex, GA 30273 and is currently estimated at $270,106, approximately $135 per square foot. 3860 Augustine Place Unit 36 is a home located in Clayton County with nearby schools including Roberta T. Smith Elementary School, Rex Mill Middle School, and Morrow High School.
Ownership History
Date
Name
Owned For
Owner Type
Purchase Details
Closed on
Jun 18, 2021
Sold by
Johnson Rhonda Melisa
Bought by
Socree Thaddeus
Current Estimated Value
Home Financials for this Owner
Home Financials are based on the most recent Mortgage that was taken out on this home.
Original Mortgage
$207,580
Outstanding Balance
$187,117
Interest Rate
2.9%
Mortgage Type
New Conventional
Estimated Equity
$82,989
Purchase Details
Closed on
Jan 20, 2021
Sold by
Wooden Rhonda
Bought by
Johnson Rhonda Melisa
Purchase Details
Closed on
Jun 6, 2016
Sold by
Bailey Clarence
Bought by
Bailey Clarence and Wooten Rhonda
Purchase Details
Closed on
Oct 24, 2011
Sold by
John Hancock Homes Inc
Bought by
Bailey Clarence
Home Financials for this Owner
Home Financials are based on the most recent Mortgage that was taken out on this home.
Original Mortgage
$83,718
Interest Rate
4.16%
Mortgage Type
FHA
Create a Home Valuation Report for This Property
The Home Valuation Report is an in-depth analysis detailing your home's value as well as a comparison with similar homes in the area
Home Values in the Area
Average Home Value in this Area
Purchase History
| Date | Buyer | Sale Price | Title Company |
|---|---|---|---|
| Socree Thaddeus | $214,000 | -- | |
| Johnson Rhonda Melisa | -- | -- | |
| Bailey Clarence | -- | -- | |
| Bailey Clarence | $85,900 | -- |
Source: Public Records
Mortgage History
| Date | Status | Borrower | Loan Amount |
|---|---|---|---|
| Open | Socree Thaddeus | $207,580 | |
| Previous Owner | Bailey Clarence | $83,718 |
Source: Public Records
Tax History
| Year | Tax Paid | Tax Assessment Tax Assessment Total Assessment is a certain percentage of the fair market value that is determined by local assessors to be the total taxable value of land and additions on the property. | Land | Improvement |
|---|---|---|---|---|
| 2025 | $3,070 | $89,160 | $8,800 | $80,360 |
| 2024 | $3,161 | $90,040 | $8,800 | $81,240 |
| 2023 | $3,424 | $94,840 | $8,800 | $86,040 |
| 2022 | $2,655 | $76,680 | $8,800 | $67,880 |
| 2021 | $2,768 | $69,120 | $8,800 | $60,320 |
| 2020 | $2,627 | $64,722 | $8,800 | $55,922 |
| 2019 | $2,343 | $56,780 | $7,200 | $49,580 |
| 2018 | $2,267 | $54,916 | $7,200 | $47,716 |
| 2017 | $1,731 | $41,598 | $7,200 | $34,398 |
| 2016 | $1,414 | $33,807 | $7,200 | $26,607 |
| 2015 | $1,391 | $0 | $0 | $0 |
| 2014 | $1,288 | $31,421 | $7,200 | $24,221 |
Source: Public Records
Map
Nearby Homes
- 3824 Augustine Place
- 6435 Cumberland Dr
- 6661 Highway 42
- 6670 Sunset Hills Blvd
- 6814 Biscayne
- 3769 Brookwood Blvd
- 6708 Sunset Hills Blvd
- 6683 Homestead Rd
- 85 Homestead Place
- 6716 Teresa Ln
- 6667 Sunset Park Unit III
- 100 Homestead Place
- 6746 Sunset Hills Blvd
- 6750 Sunset Hills Blvd
- 3712 Skyline Place
- 6702 Saganaw Dr
- 6608 Chesepeake Trail
- 6604 Chesepeake Trail
- 6737 Biscayne Blvd
- 0 Lakeland Rd Unit 7648836
- 3860 Augustine Place
- 3862 Augustine Place
- 3858 Augustine Place Unit 35
- 3858 Augustine Place
- 3856 Augustine Place Unit 34
- 3856 Augustine Place
- 3866 Augustine Place
- 3866 Augustine Place Unit 3866
- 3854 Augustine Place Unit 3854
- 3854 Augustine Place
- 3854 Augustine Place Unit 33
- 3852 Augustine Place Unit 32
- 3852 Augustine Place
- 3850 Augustine Place
- 3881 Augustine Place Unit 95
- 3848 Augustine Place Unit 30
- 3848 Augustine Place
- 3883 Augustine Place
- 3855 Augustine Place Unit 96
- 3855 Augustine Place
Your Personal Tour Guide
Ask me questions while you tour the home.