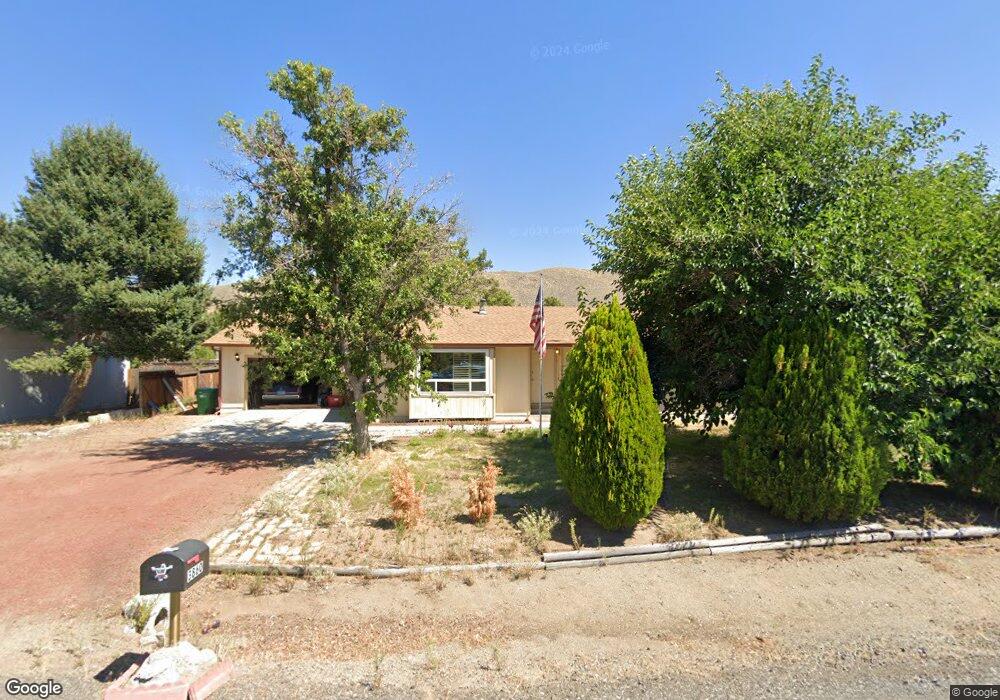
3860 Brant St Reno, NV 89508
Cold Springs NeighborhoodEstimated Value: $384,000 - $403,000
3
Beds
2
Baths
1,356
Sq Ft
$291/Sq Ft
Est. Value
About This Home
This home is located at 3860 Brant St, Reno, NV 89508 and is currently estimated at $394,036, approximately $290 per square foot. 3860 Brant St is a home located in Washoe County with nearby schools including Nancy Gomes Elementary School, Cold Springs Middle School, and North Valleys High School.
Ownership History
Date
Name
Owned For
Owner Type
Purchase Details
Closed on
Jun 22, 2021
Sold by
Rich Charles and Rich Zoila Beatriz
Bought by
Rich Charles and Rich Beatriz
Current Estimated Value
Purchase Details
Closed on
Apr 5, 2021
Sold by
Gump Melanie
Bought by
Rich Charles and Rich Zoila Beatriz
Home Financials for this Owner
Home Financials are based on the most recent Mortgage that was taken out on this home.
Original Mortgage
$326,337
Outstanding Balance
$292,720
Interest Rate
3%
Mortgage Type
VA
Estimated Equity
$101,316
Purchase Details
Closed on
Feb 4, 2021
Sold by
Gump Melanie and Estate Of Yoneko Newman
Bought by
Gump Melanie
Home Financials for this Owner
Home Financials are based on the most recent Mortgage that was taken out on this home.
Original Mortgage
$326,337
Outstanding Balance
$292,720
Interest Rate
3%
Mortgage Type
VA
Estimated Equity
$101,316
Create a Home Valuation Report for This Property
The Home Valuation Report is an in-depth analysis detailing your home's value as well as a comparison with similar homes in the area
Home Values in the Area
Average Home Value in this Area
Purchase History
| Date | Buyer | Sale Price | Title Company |
|---|---|---|---|
| Rich Charles | -- | None Available | |
| Rich Charles | $319,000 | First American Title Reno | |
| Gump Melanie | -- | None Available |
Source: Public Records
Mortgage History
| Date | Status | Borrower | Loan Amount |
|---|---|---|---|
| Open | Rich Charles | $326,337 |
Source: Public Records
Tax History
| Year | Tax Paid | Tax Assessment Tax Assessment Total Assessment is a certain percentage of the fair market value that is determined by local assessors to be the total taxable value of land and additions on the property. | Land | Improvement |
|---|---|---|---|---|
| 2026 | $887 | $63,517 | $30,065 | $33,452 |
| 2024 | $1,150 | $59,827 | $24,710 | $35,117 |
| 2023 | $1,117 | $62,258 | $28,665 | $33,593 |
| 2022 | $1,084 | $53,165 | $24,885 | $28,280 |
| 2021 | $1,053 | $45,462 | $17,010 | $28,452 |
| 2020 | $989 | $45,656 | $16,940 | $28,716 |
| 2019 | $960 | $43,455 | $15,435 | $28,020 |
| 2018 | $932 | $38,731 | $11,095 | $27,636 |
| 2017 | $905 | $37,552 | $9,660 | $27,892 |
| 2016 | $882 | $37,879 | $9,205 | $28,674 |
| 2015 | $880 | $36,348 | $7,455 | $28,893 |
| 2014 | $854 | $32,031 | $5,495 | $26,536 |
| 2013 | -- | $25,596 | $3,325 | $22,271 |
Source: Public Records
Map
Nearby Homes
- 3825 Dyal Ct
- 17130 E Opal Ct
- 3940 Vireo Ct
- 17527 Sunstone Ct
- 17533 Javalina Ct
- 17862 Bear River Ct
- 3440 Canvasback Ln
- 17575 Thrush Ln
- 17839 Empire Ct
- 5005 Azurite Dr
- 17115 Garnet Dr
- 3855 Sandpiper Dr
- 17685 Mockingbird Ct
- 18300 Alderwood Ct
- 17791 Brushland Dr
- 17755 Fantail Cir
- 17295 Magnetite Dr
- 4080 Goldfinch Dr
- 18205 Fontana Ct
- 5085 Bobolink Cir
- 3850 Brant St
- 3870 Brant St
- 3945 Shearwater Dr
- 3935 Shearwater Dr
- 3955 Shearwater Dr
- 3840 Brant St
- 3855 Brant St
- 3845 Brant St
- 3925 Shearwater Dr
- 3865 Brant St
- 3805 Avocet Ct
- 3835 Brant St
- 3815 Avocet Ct
- 3830 Brant St
- 3870 Shearwater Dr
- 3915 Shearwater Dr
- 3825 Avocet Ct
- 3860 Shearwater Dr
- 17360 Egret Ln
- 3825 Brant St
Your Personal Tour Guide
Ask me questions while you tour the home.