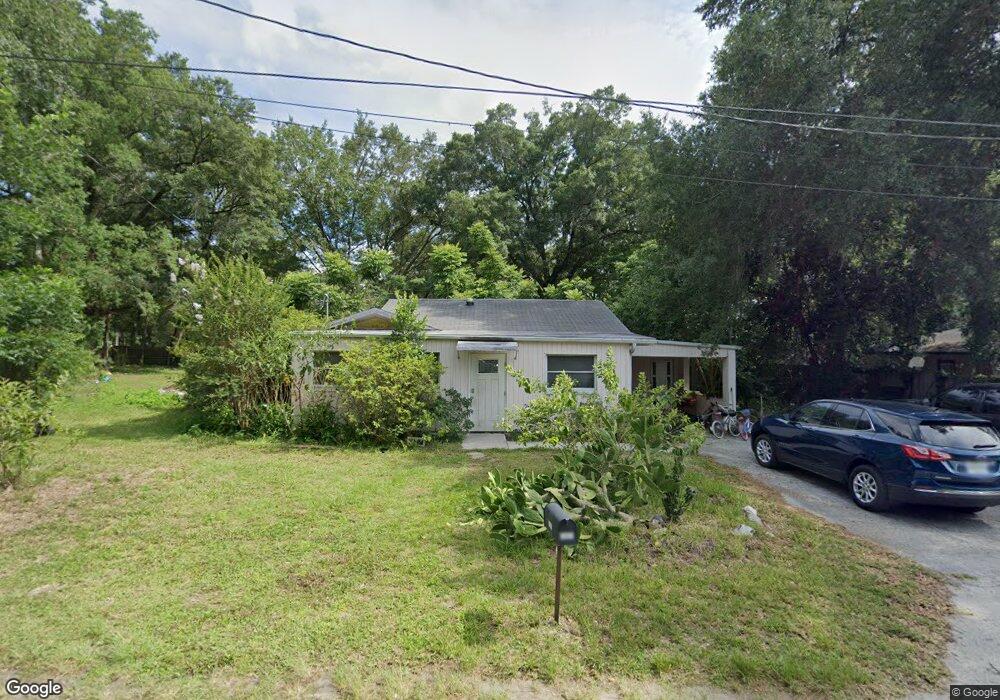
3860 E Sanders St Inverness, FL 34453
Estimated Value: $177,774 - $229,000
2
Beds
1
Bath
1,100
Sq Ft
$189/Sq Ft
Est. Value
About This Home
This home is located at 3860 E Sanders St, Inverness, FL 34453 and is currently estimated at $207,444, approximately $188 per square foot. 3860 E Sanders St is a home located in Citrus County with nearby schools including Hernando Elementary School, Inverness Middle School, and Citrus High School.
Ownership History
Date
Name
Owned For
Owner Type
Purchase Details
Closed on
Oct 22, 2024
Sold by
Giordano Nicole Biscardi and Giordano Leonard
Bought by
Giordano Leonard
Current Estimated Value
Purchase Details
Closed on
Aug 16, 2011
Sold by
Lee Bennet Tome and Lee Bennet
Bought by
Giordano Leonard and Biscardi Nicole
Home Financials for this Owner
Home Financials are based on the most recent Mortgage that was taken out on this home.
Original Mortgage
$56,000
Interest Rate
6.5%
Mortgage Type
Seller Take Back
Purchase Details
Closed on
Jul 18, 2007
Sold by
Crews Jahu
Bought by
Bennett Tom and Bennett Lee
Purchase Details
Closed on
Feb 9, 2000
Sold by
Crews Jahu and Crews Shirley
Bought by
Moore James
Purchase Details
Closed on
May 1, 1999
Bought by
Giordano Leonard and Giordano Nicole Biscardi
Purchase Details
Closed on
Apr 1, 1999
Bought by
Giordano Leonard and Giordano Nicole Biscardi
Create a Home Valuation Report for This Property
The Home Valuation Report is an in-depth analysis detailing your home's value as well as a comparison with similar homes in the area
Home Values in the Area
Average Home Value in this Area
Purchase History
| Date | Buyer | Sale Price | Title Company |
|---|---|---|---|
| Giordano Leonard | $100 | None Listed On Document | |
| Giordano Leonard | $56,000 | American Title Services Of C | |
| Bennett Tom | $65,000 | Title Offices Llc | |
| Moore James | -- | -- | |
| Giordano Leonard | $100 | -- | |
| Giordano Leonard | $100 | -- |
Source: Public Records
Mortgage History
| Date | Status | Borrower | Loan Amount |
|---|---|---|---|
| Previous Owner | Giordano Leonard | $56,000 |
Source: Public Records
Tax History
| Year | Tax Paid | Tax Assessment Tax Assessment Total Assessment is a certain percentage of the fair market value that is determined by local assessors to be the total taxable value of land and additions on the property. | Land | Improvement |
|---|---|---|---|---|
| 2025 | $1,570 | $128,042 | $17,120 | $110,922 |
| 2024 | $1,530 | $127,081 | $14,880 | $112,201 |
| 2023 | $1,530 | $128,834 | $13,600 | $115,234 |
| 2022 | $1,274 | $98,778 | $8,800 | $89,978 |
| 2021 | $1,088 | $75,090 | $7,680 | $67,410 |
| 2020 | $958 | $68,118 | $6,880 | $61,238 |
| 2019 | $851 | $55,067 | $6,080 | $48,987 |
| 2018 | $732 | $45,940 | $5,200 | $40,740 |
| 2017 | $677 | $40,418 | $4,620 | $35,798 |
| 2016 | $627 | $34,179 | $4,620 | $29,559 |
| 2015 | $617 | $33,030 | $4,620 | $28,410 |
| 2014 | $630 | $32,650 | $5,786 | $26,864 |
Source: Public Records
Map
Nearby Homes
- 3645 E Sanders St
- 3858 E Byrd St
- 3916 E Grant St
- 3934 E Grant St
- 3956 E Grant St
- 3764 E Sanders St
- 3953 E Grant
- 4087 E Dano St
- 3671 E Ryan St
- 3992 E Walker St
- 3802 E Ryan St
- 3910 E Scotty St
- 3943 E Scotty St
- 3711 E Beck St
- 3941 E Beck St
- 4043 E Dano St
- 4053 E Grant St
- 3980 E Bennett St
- 3618 E Maxwell Place
- 35 N Baker Terrace
- 3852 E Sanders St
- 3896 E Sanders St
- 3881 E Byrd St
- 3879 E Sanders St
- 3863 E Sanders St
- 3912 E Sanders St
- 3838 E Sanders St
- 3912 E Byrd St
- 0 E Byrd St
- 3843 E Sanders St
- 3915 E Byrd St
- 3953 E Sanders St
- 4034 E Sanders St
- 3880 E Byrd St
- 3882 E Grant St
- 3971 E Byrd St
- 3958 E Byrd St
- 0 N Kershaw Way
- 3900 E Grant St
- 3944 E Sanders St
Your Personal Tour Guide
Ask me questions while you tour the home.