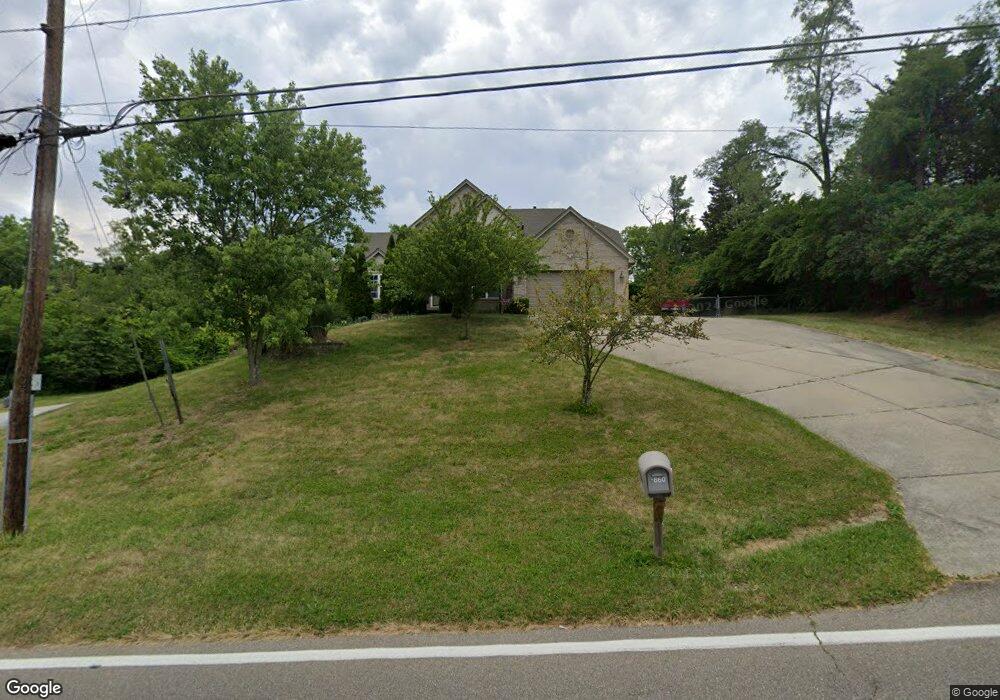
3860 Reemelin Rd Cincinnati, OH 45211
South Monfort Heights NeighborhoodEstimated Value: $386,000 - $418,000
4
Beds
3
Baths
2,170
Sq Ft
$184/Sq Ft
Est. Value
About This Home
This home is located at 3860 Reemelin Rd, Cincinnati, OH 45211 and is currently estimated at $399,182, approximately $183 per square foot. 3860 Reemelin Rd is a home located in Hamilton County with nearby schools including Oakdale Elementary School, Bridgetown Middle School, and Oak Hills High School.
Ownership History
Date
Name
Owned For
Owner Type
Purchase Details
Closed on
Aug 19, 2003
Sold by
Meyer Builders Douglas Homes Ltd
Bought by
Pfenninger Steve M and Niehaus Pfenninger Mary
Current Estimated Value
Home Financials for this Owner
Home Financials are based on the most recent Mortgage that was taken out on this home.
Original Mortgage
$167,000
Outstanding Balance
$75,410
Interest Rate
5.97%
Mortgage Type
Unknown
Estimated Equity
$323,772
Purchase Details
Closed on
Mar 12, 2003
Sold by
Lee Niehaus Mary and Lee Steve
Bought by
Meyer Builders Douglas Homes Ltd
Home Financials for this Owner
Home Financials are based on the most recent Mortgage that was taken out on this home.
Original Mortgage
$14,000,000
Interest Rate
6.02%
Mortgage Type
Construction
Create a Home Valuation Report for This Property
The Home Valuation Report is an in-depth analysis detailing your home's value as well as a comparison with similar homes in the area
Home Values in the Area
Average Home Value in this Area
Purchase History
| Date | Buyer | Sale Price | Title Company |
|---|---|---|---|
| Pfenninger Steve M | $237,700 | -- | |
| Meyer Builders Douglas Homes Ltd | $30,000 | First Title Agency Inc |
Source: Public Records
Mortgage History
| Date | Status | Borrower | Loan Amount |
|---|---|---|---|
| Open | Pfenninger Steve M | $167,000 | |
| Previous Owner | Meyer Builders Douglas Homes Ltd | $14,000,000 |
Source: Public Records
Tax History Compared to Growth
Tax History
| Year | Tax Paid | Tax Assessment Tax Assessment Total Assessment is a certain percentage of the fair market value that is determined by local assessors to be the total taxable value of land and additions on the property. | Land | Improvement |
|---|---|---|---|---|
| 2024 | $5,773 | $113,750 | $19,607 | $94,143 |
| 2023 | $6,286 | $123,757 | $19,607 | $104,150 |
| 2022 | $5,767 | $96,258 | $19,037 | $77,221 |
| 2021 | $5,179 | $96,258 | $19,037 | $77,221 |
| 2020 | $5,246 | $96,258 | $19,037 | $77,221 |
| 2019 | $5,134 | $85,943 | $16,996 | $68,947 |
| 2018 | $5,141 | $85,943 | $16,996 | $68,947 |
| 2017 | $4,845 | $85,943 | $16,996 | $68,947 |
| 2016 | $4,352 | $77,067 | $16,996 | $60,071 |
| 2015 | $4,390 | $77,067 | $16,996 | $60,071 |
| 2014 | $4,396 | $77,067 | $16,996 | $60,071 |
| 2013 | $4,107 | $77,067 | $16,996 | $60,071 |
Source: Public Records
Map
Nearby Homes
- 3743 Centurion Dr
- 3774 Ridgewood Ave
- 3579 Rackacres Dr
- 4125 Quaker Hill Dr
- 4911 N Bend Rd
- 4820 N Bend Rd
- 4830 N Bend Rd
- 4808 N Bend Rd
- 4798 N Bend Rd
- 3640 Westwood Northern Blvd
- 4790 N Bend Rd
- 0 Westwood Northern Blvd Unit 1851736
- 4201 Boomer Rd
- 3608 Westwood Northern Blvd
- 3775 Boomer Rd
- 3352 Emerald Lakes Dr Unit 1-A
- 3354 Forestview Gardens Dr
- 3363 Diehl Rd
- 4104 Trevor Ave
- 4038 Washington Ave
- 3840 Reemelin Rd
- 3890 Reemelin Rd
- 3830 Reemelin Rd
- 3900 Reemelin Rd
- 3820 Reemelin Rd
- 3808 Reemelin Rd
- 3796 Reemelin Rd
- 3793 Reemelin Rd
- 3784 Reemelin Rd
- 3783 Reemelin Rd
- 3708 Crestnoll Ln
- 3762 Reemelin Rd
- 3771 Reemelin Rd
- 3760 Centurion Dr
- 3698 Crestnoll Ln
- 3757 Reemelin Rd
- 3704 Crestnoll Ln
- 3694 Crestnoll Ln
- 3745 Reemelin Rd
- 3772 Centurion Dr