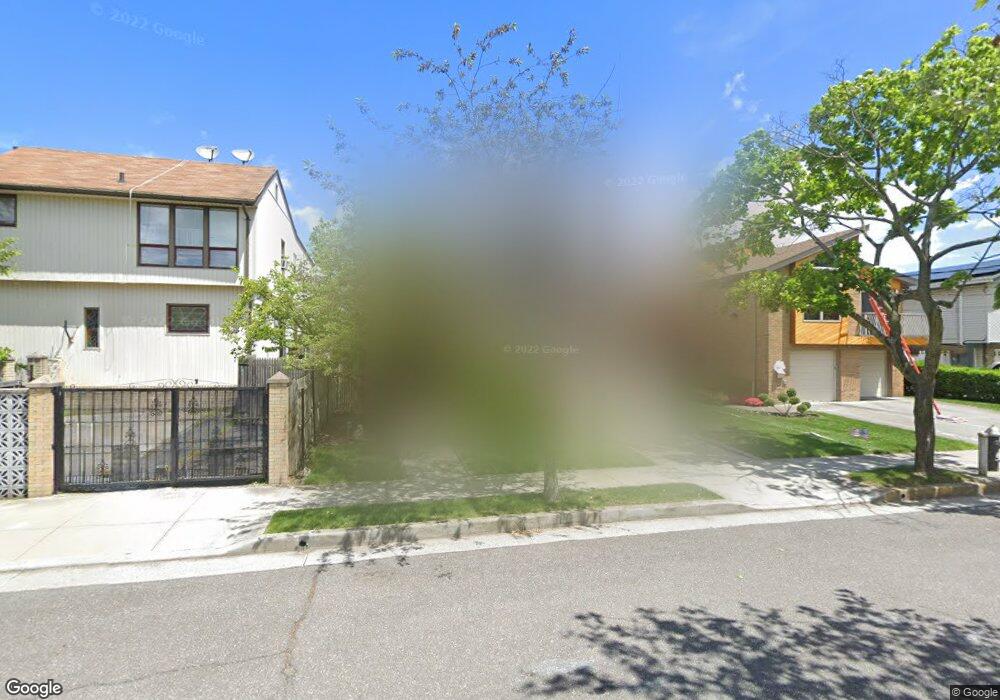
3861 233rd St Little Neck, NY 11363
Douglaston NeighborhoodEstimated Value: $1,201,835 - $1,466,000
--
Bed
--
Bath
2,128
Sq Ft
$614/Sq Ft
Est. Value
About This Home
This home is located at 3861 233rd St, Little Neck, NY 11363 and is currently estimated at $1,306,209, approximately $613 per square foot. 3861 233rd St is a home located in Queens County with nearby schools including P.S. 098 The Douglaston School, Louis Pasteur Middle School 67, and Benjamin N Cardozo High School.
Ownership History
Date
Name
Owned For
Owner Type
Purchase Details
Closed on
Aug 12, 2021
Sold by
Hong Xiao Qiong and Hung Bing Ling
Bought by
Hung Bing Ling and Song Kent Ming
Current Estimated Value
Home Financials for this Owner
Home Financials are based on the most recent Mortgage that was taken out on this home.
Original Mortgage
$500,000
Outstanding Balance
$453,970
Interest Rate
2.8%
Mortgage Type
Purchase Money Mortgage
Estimated Equity
$852,239
Purchase Details
Closed on
May 10, 2006
Sold by
Theoharis Bill and Theoharis Suady
Bought by
Hong Xiao Qiong and Hung Bing Ling
Home Financials for this Owner
Home Financials are based on the most recent Mortgage that was taken out on this home.
Original Mortgage
$400,000
Interest Rate
6.55%
Mortgage Type
Purchase Money Mortgage
Create a Home Valuation Report for This Property
The Home Valuation Report is an in-depth analysis detailing your home's value as well as a comparison with similar homes in the area
Home Values in the Area
Average Home Value in this Area
Purchase History
| Date | Buyer | Sale Price | Title Company |
|---|---|---|---|
| Hung Bing Ling | -- | -- | |
| Hong Xiao Qiong | $930,000 | -- |
Source: Public Records
Mortgage History
| Date | Status | Borrower | Loan Amount |
|---|---|---|---|
| Open | Hung Bing Ling | $500,000 | |
| Closed | Hong Xiao Qiong | $400,000 |
Source: Public Records
Tax History Compared to Growth
Tax History
| Year | Tax Paid | Tax Assessment Tax Assessment Total Assessment is a certain percentage of the fair market value that is determined by local assessors to be the total taxable value of land and additions on the property. | Land | Improvement |
|---|---|---|---|---|
| 2025 | $11,727 | $59,789 | $11,354 | $48,435 |
| 2024 | $11,739 | $59,789 | $12,441 | $47,348 |
| 2023 | $11,637 | $59,340 | $12,166 | $47,174 |
| 2022 | $10,889 | $57,780 | $14,220 | $43,560 |
| 2021 | $10,819 | $59,640 | $14,220 | $45,420 |
| 2020 | $10,250 | $65,580 | $14,220 | $51,360 |
| 2019 | $10,130 | $72,240 | $14,220 | $58,020 |
| 2018 | $9,783 | $49,450 | $12,362 | $37,088 |
| 2017 | $9,210 | $46,651 | $10,693 | $35,958 |
| 2016 | $8,488 | $46,651 | $10,693 | $35,958 |
| 2015 | $5,254 | $41,520 | $15,780 | $25,740 |
| 2014 | $5,254 | $41,520 | $15,780 | $25,740 |
Source: Public Records
Map
Nearby Homes
- 233-17 38th Dr
- 233-25 38th Dr
- 23338 38th Dr
- 38-30 Douglaston Pkwy Unit G2
- 38-30 Douglaston Pkwy Unit H4
- 38-47 Douglaston Pkwy
- 20 Ridge Rd
- 26 Cherry St
- 42-30 Douglaston Pkwy Unit 2P
- 42-30 Douglaston Pkwy Unit 3-L
- 24038 Poplar St
- 28 W 38th St Unit 2
- 28 W 38th St Unit 6E
- 329 Forest Rd
- 43-25 Douglaston Pkwy Unit 2D
- 43-25 Douglaston Pkwy Unit B
- 301 Park Ln
- 233-12 Bay St
- 41-27 Orient Ave
- 44-20 Douglaston Pkwy Unit 5A