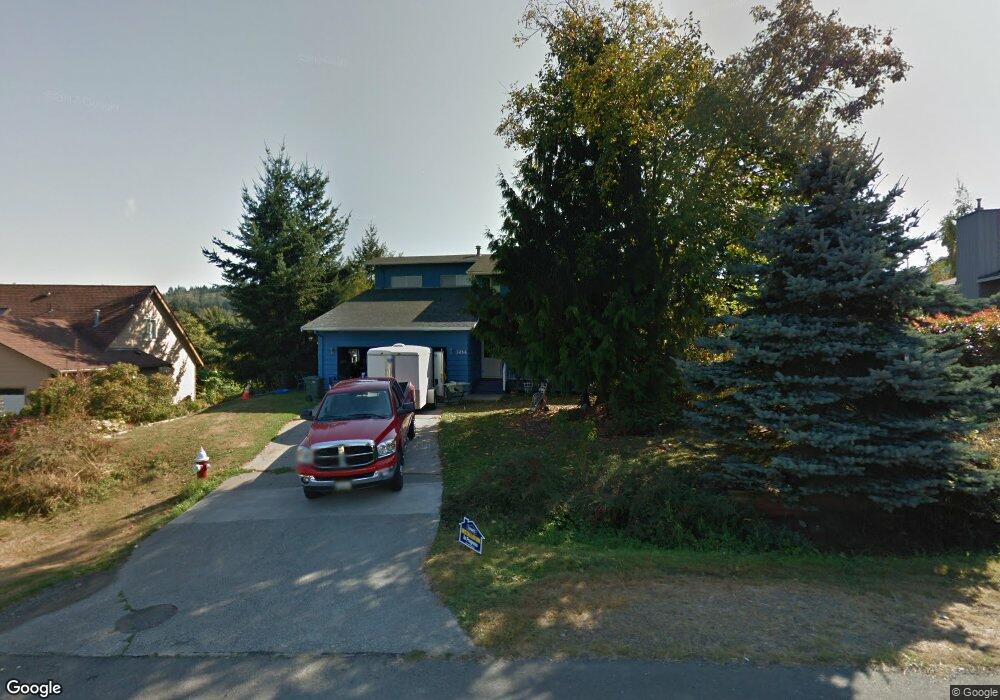
3864 Robby Ct Bellingham, WA 98226
Estimated Value: $731,000 - $784,000
3
Beds
3
Baths
2,232
Sq Ft
$339/Sq Ft
Est. Value
About This Home
This home is located at 3864 Robby Ct, Bellingham, WA 98226 and is currently estimated at $756,408, approximately $338 per square foot. 3864 Robby Ct is a home located in Whatcom County with nearby schools including Silver Beach Elementary School, Whatcom Middle School, and Squalicum High School.
Ownership History
Date
Name
Owned For
Owner Type
Purchase Details
Closed on
Mar 1, 2007
Sold by
Symons Lawrence A
Bought by
Symons Lawrence A and Symons Janai Powell
Current Estimated Value
Purchase Details
Closed on
Mar 22, 2006
Sold by
Symons Lawrence A and Mcleod Gillian
Bought by
Symons Lawrence A
Purchase Details
Closed on
Jul 25, 2001
Sold by
Freestone Jean M
Bought by
Symons Lawrence Andre and Mcleod Gillian M
Home Financials for this Owner
Home Financials are based on the most recent Mortgage that was taken out on this home.
Original Mortgage
$147,048
Outstanding Balance
$57,361
Interest Rate
7.15%
Mortgage Type
FHA
Estimated Equity
$699,047
Create a Home Valuation Report for This Property
The Home Valuation Report is an in-depth analysis detailing your home's value as well as a comparison with similar homes in the area
Home Values in the Area
Average Home Value in this Area
Purchase History
| Date | Buyer | Sale Price | Title Company |
|---|---|---|---|
| Symons Lawrence A | -- | None Available | |
| Symons Lawrence A | -- | None Available | |
| Symons Lawrence Andre | $133,660 | Chicago Title Insurance |
Source: Public Records
Mortgage History
| Date | Status | Borrower | Loan Amount |
|---|---|---|---|
| Open | Symons Lawrence Andre | $147,048 |
Source: Public Records
Tax History Compared to Growth
Tax History
| Year | Tax Paid | Tax Assessment Tax Assessment Total Assessment is a certain percentage of the fair market value that is determined by local assessors to be the total taxable value of land and additions on the property. | Land | Improvement |
|---|---|---|---|---|
| 2024 | $5,648 | $642,528 | $213,840 | $428,688 |
| 2023 | $5,648 | $670,787 | $223,245 | $447,542 |
| 2022 | $4,478 | $545,355 | $181,500 | $363,855 |
| 2021 | $4,561 | $450,707 | $150,000 | $300,707 |
| 2020 | $4,450 | $431,725 | $132,405 | $299,320 |
| 2019 | $3,962 | $403,350 | $123,803 | $279,547 |
| 2018 | $4,107 | $361,777 | $111,053 | $250,724 |
| 2017 | $3,576 | $320,103 | $98,260 | $221,843 |
| 2016 | $3,304 | $290,895 | $89,420 | $201,475 |
| 2015 | $3,382 | $277,155 | $85,000 | $192,155 |
| 2014 | -- | $275,874 | $82,560 | $193,314 |
| 2013 | -- | $264,064 | $80,000 | $184,064 |
Source: Public Records
Map
Nearby Homes
- 1430 Welling Rd
- 1379 Northwood Ct
- 3785 Greenville Place
- 1314 Welling Rd
- 3871 Cindy Ln
- 1368 Roma Rd
- 1580 Hillsdale Rd
- 3666 Woodlake Rd
- 3713 Bristol St
- 3606 Tree Farm Ct
- 4055 Springland Ct
- 3709 Bristol St
- 3715 E Sunset Dr
- 3817 E Sunset Dr
- 4121 Malachite Dr
- 3827 Keystone Way
- 3527 Sussex Dr
- 4431 Alice St
- 4136 Malachite Dr
- 4414 Alice St