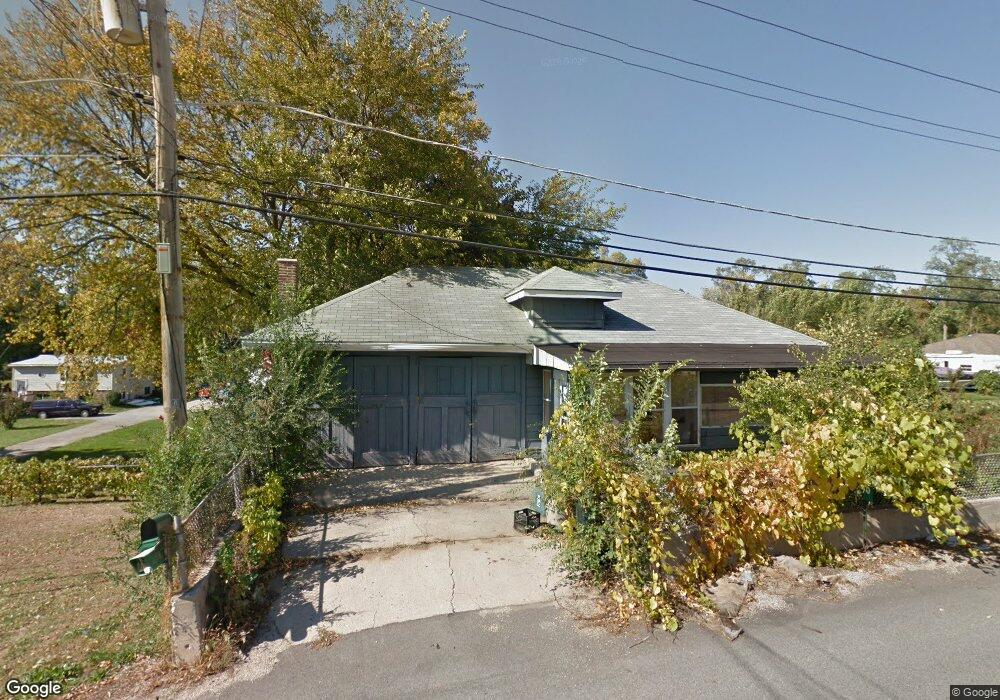
38640 N Drexel Blvd Antioch, IL 60002
Klondike NeighborhoodEstimated Value: $101,000 - $210,000
2
Beds
1
Bath
900
Sq Ft
$177/Sq Ft
Est. Value
About This Home
This home is located at 38640 N Drexel Blvd, Antioch, IL 60002 and is currently estimated at $159,446, approximately $177 per square foot. 38640 N Drexel Blvd is a home located in Lake County with nearby schools including Grass Lake Elementary School and Antioch Community High School.
Ownership History
Date
Name
Owned For
Owner Type
Purchase Details
Closed on
Apr 19, 2013
Sold by
Wells Fargo Bank Na
Bought by
Rv Holdings Seven Llc
Current Estimated Value
Purchase Details
Closed on
Aug 6, 2012
Sold by
Stevens Dawn M
Bought by
Wells Fargo Bank Na and Park Place Securities Inc
Purchase Details
Closed on
Dec 4, 2003
Sold by
Wong Matthew and Wong Sharon
Bought by
Stevens Dawn
Home Financials for this Owner
Home Financials are based on the most recent Mortgage that was taken out on this home.
Original Mortgage
$74,800
Interest Rate
8.7%
Mortgage Type
Unknown
Purchase Details
Closed on
Dec 19, 1996
Sold by
Pierce Sharon L and Wong Sharon
Bought by
Wong Matthew and Wong Sharon
Home Financials for this Owner
Home Financials are based on the most recent Mortgage that was taken out on this home.
Original Mortgage
$41,250
Interest Rate
7.58%
Mortgage Type
Balloon
Purchase Details
Closed on
Jul 15, 1909
Sold by
Rv Holdings Seven Llc
Bought by
Pierce Cindie
Create a Home Valuation Report for This Property
The Home Valuation Report is an in-depth analysis detailing your home's value as well as a comparison with similar homes in the area
Home Values in the Area
Average Home Value in this Area
Purchase History
| Date | Buyer | Sale Price | Title Company |
|---|---|---|---|
| Rv Holdings Seven Llc | $26,500 | None Available | |
| Wells Fargo Bank Na | -- | None Available | |
| Stevens Dawn | $93,500 | Multiple | |
| Wong Matthew | -- | -- | |
| Pierce Cindie | $20,000 | None Available |
Source: Public Records
Mortgage History
| Date | Status | Borrower | Loan Amount |
|---|---|---|---|
| Previous Owner | Stevens Dawn | $74,800 | |
| Previous Owner | Wong Matthew | $41,250 |
Source: Public Records
Tax History Compared to Growth
Tax History
| Year | Tax Paid | Tax Assessment Tax Assessment Total Assessment is a certain percentage of the fair market value that is determined by local assessors to be the total taxable value of land and additions on the property. | Land | Improvement |
|---|---|---|---|---|
| 2024 | $2,982 | $36,020 | $4,209 | $31,811 |
| 2023 | $2,846 | $32,253 | $3,769 | $28,484 |
| 2022 | $2,846 | $30,395 | $4,451 | $25,944 |
| 2021 | $2,657 | $28,361 | $4,153 | $24,208 |
| 2020 | $2,607 | $27,577 | $4,038 | $23,539 |
| 2019 | $2,687 | $26,372 | $3,862 | $22,510 |
| 2018 | $739 | $7,256 | $2,792 | $4,464 |
| 2017 | $725 | $6,907 | $2,658 | $4,249 |
| 2016 | $719 | $23,279 | $2,565 | $20,714 |
| 2015 | $2,535 | $22,687 | $2,500 | $20,187 |
| 2014 | $2,752 | $25,295 | $3,730 | $21,565 |
| 2012 | $2,257 | $26,430 | $3,730 | $22,700 |
Source: Public Records
Map
Nearby Homes
- 38635 N Drexel Blvd
- 38830 N Drexel Blvd
- 38815 N Broadway Ave
- 26633 W Astor St
- 26700 W Woodland Ave
- 39203 Rangers Way
- 38871 N Lakeview Ave
- 39225 Rangers Way
- 39224 N Willow Ln
- 39247 Rangers Way
- 38717 N Lake St
- 38856 N Cedar Crest Dr
- 26307 W Grass Lake Rd
- 39563 N Channel View Dr Unit 2
- 39490 N Summerside Dr
- 38408 N Primrose Path
- 25164 W Sunset Ln
- 38581 N Hillandale Dr
- 39071 N Jackson Dr
- 25073 W Megan Ct
- 38650 N Drexel Blvd
- 38643 N Drexel Blvd
- 38612 N Drexel Blvd
- 38629 N Drexel Blvd
- 38651 N Drexel Blvd
- 38623 N Drexel Blvd
- 38678 N Drexel Blvd
- 38661 N Drexel Blvd
- 38613 N Drexel Blvd
- 38603 N Drexel Blvd
- 38590 N Drexel Blvd
- 38685 N Hilltop Ave
- 38695 N Hilltop Ave
- 38675 N Hilltop Ave
- 38701 N Hilltop Ave
- 38593 N Drexel Blvd
- 38669 N Hilltop Ave
- 38683 N Drexel Blvd
- 38581 N Drexel Blvd
- 38655 N Hilltop Ave