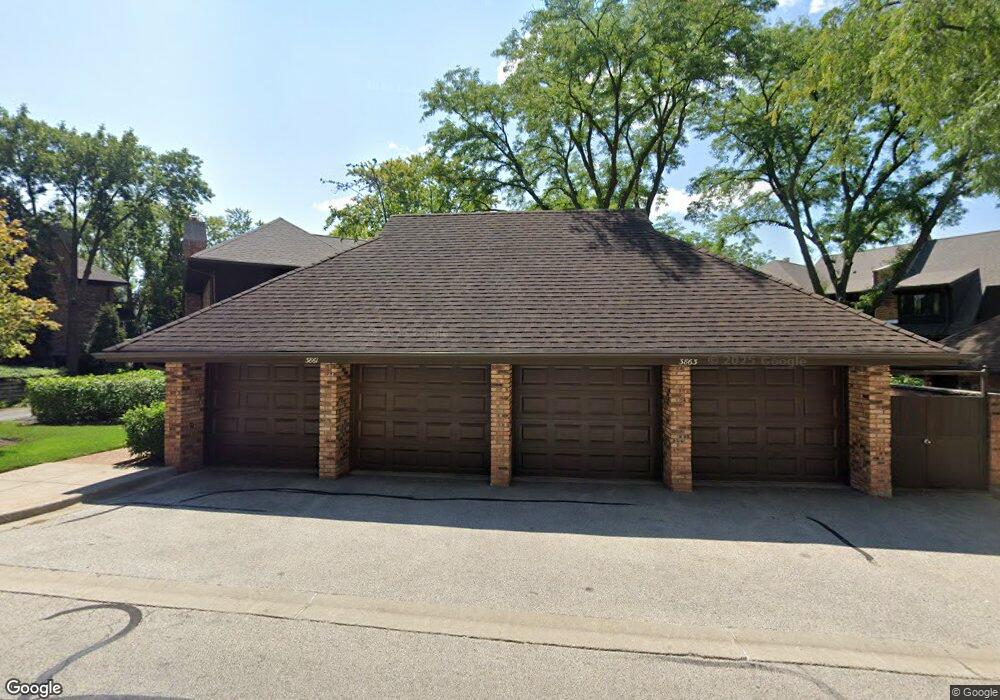
3865 Mission Hills Rd Unit 3 Northbrook, IL 60062
Estimated Value: $420,000 - $543,000
3
Beds
--
Bath
2,237
Sq Ft
$214/Sq Ft
Est. Value
About This Home
This home is located at 3865 Mission Hills Rd Unit 3, Northbrook, IL 60062 and is currently estimated at $479,533, approximately $214 per square foot. 3865 Mission Hills Rd Unit 3 is a home located in Cook County with nearby schools including Henry Winkelman Elementary School, Field Middle School, and Glenbrook North High School.
Ownership History
Date
Name
Owned For
Owner Type
Purchase Details
Closed on
Dec 13, 2021
Sold by
Victor Jeffrey and The Allan D Hersh Trust
Bought by
Lee Maristella
Current Estimated Value
Home Financials for this Owner
Home Financials are based on the most recent Mortgage that was taken out on this home.
Original Mortgage
$260,000
Outstanding Balance
$204,234
Interest Rate
2.62%
Mortgage Type
New Conventional
Estimated Equity
$275,299
Purchase Details
Closed on
Jun 14, 2019
Sold by
Hersh Allan D and Hersh Sandra J
Bought by
Hersh Allan D and Hersh Sandra J
Purchase Details
Closed on
Jun 15, 1994
Sold by
Greenbaum Michael D and Greenbaum Heather A
Bought by
Hersh Allan D and Hersh Sandra J
Home Financials for this Owner
Home Financials are based on the most recent Mortgage that was taken out on this home.
Original Mortgage
$102,000
Interest Rate
8.58%
Create a Home Valuation Report for This Property
The Home Valuation Report is an in-depth analysis detailing your home's value as well as a comparison with similar homes in the area
Home Values in the Area
Average Home Value in this Area
Purchase History
| Date | Buyer | Sale Price | Title Company |
|---|---|---|---|
| Lee Maristella | $325,000 | Chicago Title | |
| Hersh Allan D | -- | Attorney | |
| Hersh Allan D | $225,000 | First American Title |
Source: Public Records
Mortgage History
| Date | Status | Borrower | Loan Amount |
|---|---|---|---|
| Open | Lee Maristella | $260,000 | |
| Previous Owner | Hersh Allan D | $102,000 |
Source: Public Records
Tax History Compared to Growth
Tax History
| Year | Tax Paid | Tax Assessment Tax Assessment Total Assessment is a certain percentage of the fair market value that is determined by local assessors to be the total taxable value of land and additions on the property. | Land | Improvement |
|---|---|---|---|---|
| 2024 | $6,583 | $32,665 | $1,548 | $31,117 |
| 2023 | $6,531 | $32,665 | $1,548 | $31,117 |
| 2022 | $6,531 | $32,665 | $1,548 | $31,117 |
| 2021 | $5,521 | $29,953 | $1,365 | $28,588 |
| 2020 | $5,342 | $29,953 | $1,365 | $28,588 |
| 2019 | $5,159 | $32,868 | $1,365 | $31,503 |
| 2018 | $4,840 | $29,072 | $1,092 | $27,980 |
| 2017 | $4,771 | $29,072 | $1,092 | $27,980 |
| 2016 | $4,865 | $29,072 | $1,092 | $27,980 |
| 2015 | $5,384 | $29,453 | $955 | $28,498 |
| 2014 | $5,279 | $29,453 | $955 | $28,498 |
| 2013 | $5,147 | $29,453 | $955 | $28,498 |
Source: Public Records
Map
Nearby Homes
- 3860 Mission Hills Rd Unit 417
- 1891 Mission Hills Ln Unit 4
- 3900 Mission Hills Rd Unit 407
- 1935 Mission Hills Ln Unit 6C
- 3810 Mission Hills Rd Unit 502
- 3741 Mission Hills Rd Unit 110
- 3741 Mission Hills Rd Unit 209
- 3801 Mission Hills Rd Unit 204
- 3801 Mission Hills Rd Unit 304
- 3851 Mission Hills Rd Unit 409
- 3801 Mission Hills Rd Unit 510
- 3955 Mission Hills Rd Unit D
- 1620 Provenance Way
- 1671 Mission Hills Rd Unit 302
- 1671 Mission Hills Rd Unit S
- 1671 Mission Hills Rd Unit 501
- 3969 Maple Ave
- 1696 Highland Ave
- 3492 Whirlaway Dr
- 1435 Daniel Ct
- 3863 Mission Hills Rd Unit 3
- 3867 Mission Hills Rd Unit 3
- 3867 Mission Hills Rd
- 3861 Mission Hills Rd Unit 3
- 3871 Mission Hills Rd Unit 3
- 3873 Mission Hills Rd Unit 3
- 3875 Mission Hills Rd Unit 3
- 3843 Mission Hills Rd Unit 2
- 3841 Mission Hills Rd Unit 2
- 3911 Mission Hills Rd Unit 4
- 3837 Mission Hills Rd Unit 2
- 3913 Mission Hills Rd Unit 4
- 3835 Mission Hills Rd Unit 2
- 3833 Mission Hills Rd Unit 2
- 3860 Mission Hills Rd Unit 515
- 3860 Mission Hills Rd Unit 314
- 3860 Mission Hills Rd Unit 409
- 3860 Mission Hills Rd Unit 416
- 3860 Mission Hills Rd Unit 31
- 3860 Mission Hills Rd Unit 10