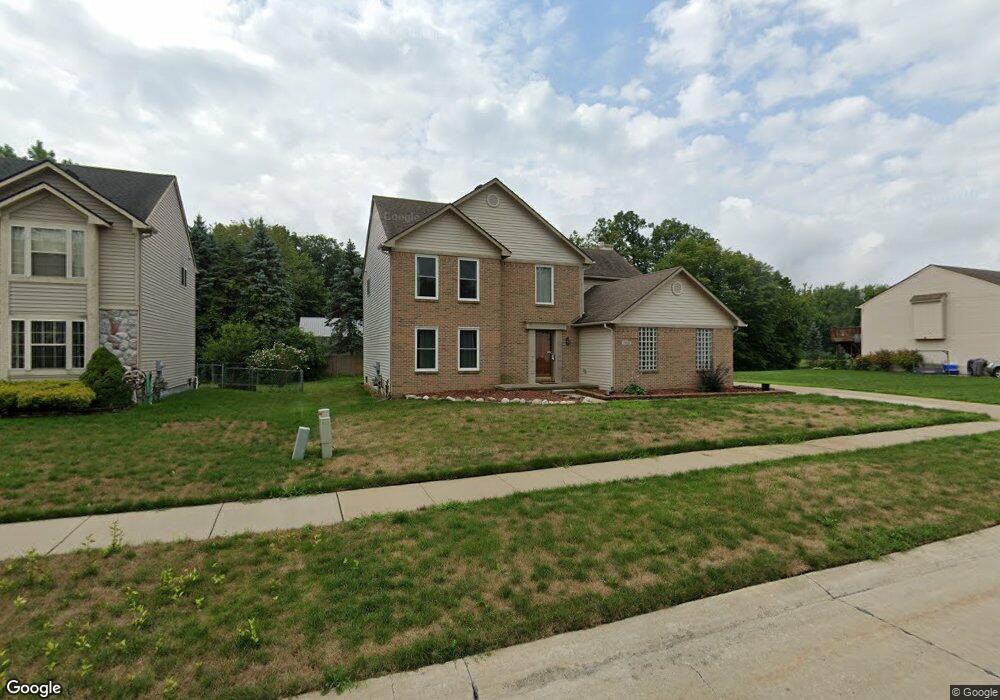
38669 Nottingham Dr Romulus, MI 48174
Estimated Value: $331,000 - $397,000
4
Beds
3
Baths
2,513
Sq Ft
$147/Sq Ft
Est. Value
About This Home
This home is located at 38669 Nottingham Dr, Romulus, MI 48174 and is currently estimated at $368,159, approximately $146 per square foot. 38669 Nottingham Dr is a home located in Wayne County with nearby schools including Wick Elementary School, Romulus Middle School, and Romulus Senior High School.
Ownership History
Date
Name
Owned For
Owner Type
Purchase Details
Closed on
Apr 23, 2025
Sold by
Starks Brian Marcel and Starks Angela Lea
Bought by
Starks Angela Lea
Current Estimated Value
Purchase Details
Closed on
Nov 21, 2016
Sold by
Starks Henry James and Campbell Starks Sharon
Bought by
Starks Brian Marcel
Home Financials for this Owner
Home Financials are based on the most recent Mortgage that was taken out on this home.
Original Mortgage
$66,500
Interest Rate
3.57%
Mortgage Type
New Conventional
Purchase Details
Closed on
May 25, 2012
Sold by
Starks Henry James
Bought by
Starks James and Starks Brian Marcel
Purchase Details
Closed on
Feb 27, 2008
Sold by
Lyons Mark J
Bought by
Federal Home Loan Mortgage Corporation
Purchase Details
Closed on
Dec 9, 2005
Sold by
Kheder Development The Commons #2 Inc
Bought by
Lyons Mark J
Purchase Details
Closed on
Apr 19, 2002
Sold by
Elro Corp
Bought by
Kheder Development The Commons #2 Inc
Create a Home Valuation Report for This Property
The Home Valuation Report is an in-depth analysis detailing your home's value as well as a comparison with similar homes in the area
Home Values in the Area
Average Home Value in this Area
Purchase History
We collect this data history from publicly available records. To have your information removed, we recommend requesting removal directly through your county’s website.
| Date | Buyer | Sale Price | Title Company |
|---|---|---|---|
| Starks Angela Lea | -- | None Listed On Document | |
| Starks Brian Marcel | -- | None Available | |
| Starks James | -- | None Available | |
| Federal Home Loan Mortgage Corporation | $228,830 | None Available | |
| Lyons Mark J | $255,988 | Metropolitan Title Company | |
| Kheder Development The Commons #2 Inc | $47,000 | Greco |
Source: Public Records
Mortgage History
We collect this data history from publicly available records. To have your information removed, we recommend requesting removal directly through your county’s website.
| Date | Status | Borrower | Loan Amount |
|---|---|---|---|
| Previous Owner | Starks Brian Marcel | $66,500 |
Source: Public Records
Tax History
| Year | Tax Paid | Tax Assessment Tax Assessment Total Assessment is a certain percentage of the fair market value that is determined by local assessors to be the total taxable value of land and additions on the property. | Land | Improvement |
|---|---|---|---|---|
| 2025 | $3,400 | $173,500 | $0 | $0 |
| 2024 | $3,417 | $160,600 | $0 | $0 |
| 2023 | $3,275 | $160,600 | $0 | $0 |
| 2022 | $4,009 | $138,900 | $0 | $0 |
| 2021 | $3,875 | $122,400 | $0 | $0 |
| 2020 | $3,773 | $117,100 | $0 | $0 |
| 2019 | $3,696 | $104,900 | $0 | $0 |
| 2018 | $2,369 | $96,700 | $0 | $0 |
| 2017 | $1,842 | $96,700 | $0 | $0 |
| 2016 | $3,127 | $88,800 | $0 | $0 |
| 2015 | $6,214 | $72,700 | $0 | $0 |
| 2013 | $6,020 | $65,800 | $0 | $0 |
| 2012 | $1,768 | $63,600 | $5,400 | $58,200 |
Source: Public Records
Map
Nearby Homes
- 8822 Cogswell St
- 39025 Buckingham Dr
- 9069 Heritage Dr
- 7065 El Paso Blvd
- 11630 Ozga St
- 7036 Ranger Dr
- 7175 Ozga St
- 37207 Ecorse Rd
- 36085 Wick Rd
- 10090 Sterling St
- 36617 Herman St
- 35901 Abbey Ct
- 35793 Concord Dr
- 6905 Arlene Ct
- 36840 Chase St
- 6887 Haggerty Rd
- 7047 Haggerty Rd
- 5894 Heyer St
- Waynecorse Wayne Course St
- 36227 Vinewood St
- 38647 Nottingham Dr
- 38699 Nottingham Dr
- 38605 Nottingham Dr
- 38658 Nottingham Dr
- 38606 Nottingham Dr
- 38751 Nottingham Dr
- 38700 Nottingham Dr
- 38553 Nottingham Dr
- 38752 Nottingham Dr
- 8754 Cogswell St
- 38554 Nottingham Dr
- 38803 Nottingham Dr
- 38501 Nottingham Dr
- 38804 Nottingham Dr
- 38502 Nottingham Dr
- 8710 Hampton Dr
- 38449 Nottingham Dr
- 38955 Nottingham Dr
- 38956 Nottingham Dr
- 8774 Cogswell St
Your Personal Tour Guide
Ask me questions while you tour the home.