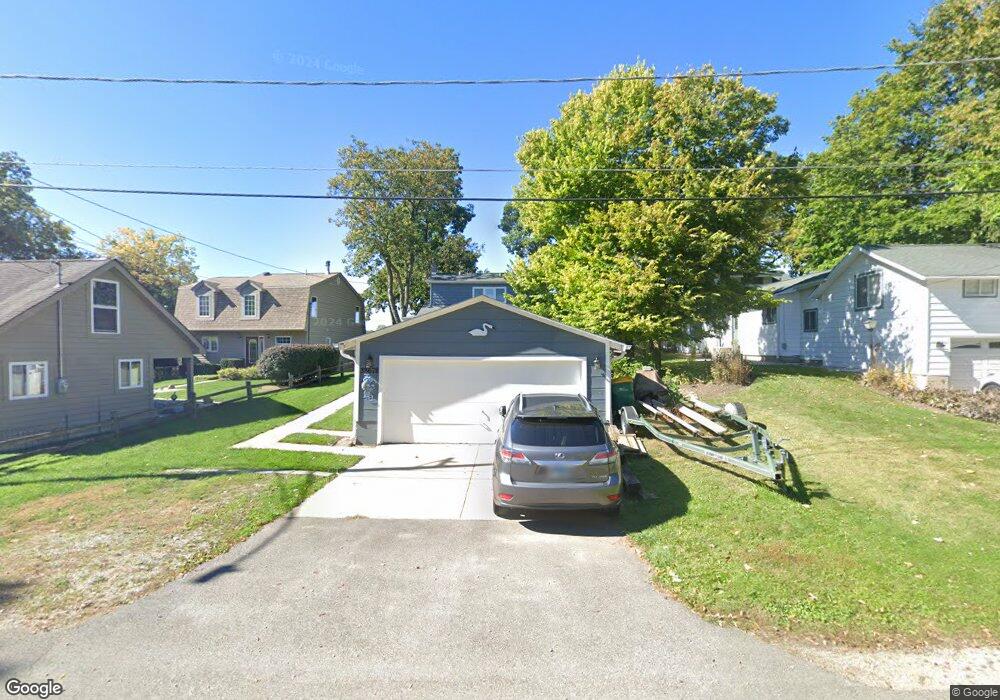
38678 N Beechwood Ave Spring Grove, IL 60081
Northeast Fox Lake NeighborhoodEstimated Value: $315,588 - $403,000
2
Beds
2
Baths
1,300
Sq Ft
$269/Sq Ft
Est. Value
About This Home
This home is located at 38678 N Beechwood Ave, Spring Grove, IL 60081 and is currently estimated at $349,397, approximately $268 per square foot. 38678 N Beechwood Ave is a home located in Lake County with nearby schools including Lotus Elementary School, Stanton Middle School, and Grant Community High School.
Ownership History
Date
Name
Owned For
Owner Type
Purchase Details
Closed on
Nov 8, 2010
Sold by
Hecht Martin
Bought by
Glen Larry T and Glen Diane J
Current Estimated Value
Purchase Details
Closed on
Aug 5, 2010
Sold by
Kathe Robert and National City Bank
Bought by
Hecht Martin
Purchase Details
Closed on
May 31, 2007
Sold by
Kathe Robert W and Lomauro Joyce
Bought by
Kathe Robert W
Home Financials for this Owner
Home Financials are based on the most recent Mortgage that was taken out on this home.
Original Mortgage
$352,000
Interest Rate
6.2%
Mortgage Type
New Conventional
Purchase Details
Closed on
Jul 31, 2001
Sold by
Mack Edward J
Bought by
Kathe Robert W and Lomauro Joyce
Home Financials for this Owner
Home Financials are based on the most recent Mortgage that was taken out on this home.
Original Mortgage
$172,000
Interest Rate
7.14%
Create a Home Valuation Report for This Property
The Home Valuation Report is an in-depth analysis detailing your home's value as well as a comparison with similar homes in the area
Home Values in the Area
Average Home Value in this Area
Purchase History
| Date | Buyer | Sale Price | Title Company |
|---|---|---|---|
| Glen Larry T | $200,000 | None Available | |
| Hecht Martin | $110,000 | None Available | |
| Kathe Robert W | -- | Greater Illinois Title Co | |
| Kathe Robert W | $215,000 | Universal Title Services Inc |
Source: Public Records
Mortgage History
| Date | Status | Borrower | Loan Amount |
|---|---|---|---|
| Previous Owner | Kathe Robert W | $352,000 | |
| Previous Owner | Kathe Robert W | $172,000 |
Source: Public Records
Tax History Compared to Growth
Tax History
| Year | Tax Paid | Tax Assessment Tax Assessment Total Assessment is a certain percentage of the fair market value that is determined by local assessors to be the total taxable value of land and additions on the property. | Land | Improvement |
|---|---|---|---|---|
| 2024 | $6,704 | $93,505 | $30,685 | $62,820 |
| 2023 | $6,744 | $83,726 | $27,476 | $56,250 |
| 2022 | $6,744 | $81,375 | $16,078 | $65,297 |
| 2021 | $6,478 | $75,930 | $15,002 | $60,928 |
| 2020 | $6,379 | $73,833 | $14,588 | $59,245 |
| 2019 | $6,028 | $70,606 | $13,950 | $56,656 |
| 2018 | $6,028 | $68,893 | $14,166 | $54,727 |
| 2017 | $5,974 | $65,575 | $13,484 | $52,091 |
| 2016 | $6,181 | $61,184 | $13,013 | $48,171 |
| 2015 | $6,244 | $59,628 | $12,682 | $46,946 |
| 2014 | $5,172 | $57,928 | $15,851 | $42,077 |
| 2012 | $5,086 | $60,143 | $15,851 | $44,292 |
Source: Public Records
Map
Nearby Homes
- 978 Eastshore Dr
- 6712 Perkins Pkwy
- 7101 Saint Tropez Ct Unit 295
- 38623 N Konen Ave
- 38480 N 6th Ave
- 8002 Honeysuckle Ct Unit T5A
- 38433 N 5th Ave
- 8215 Balsam Ct
- 38366 N 4th Ave
- 7302 Dunwood Ct Unit 115
- 8300 Reva Bay Ln Unit SLIP5
- 8300 Reva Bay Ln Unit SLIP4
- 40 Bermuda Colony Unit 7
- 58 Vail Colony Unit 11
- 52 Oak Hill Colony Unit 4
- 56 Vail Colony Unit 5
- 59 Vail Colony Unit 3
- 7314 Chevy Chase Ct Unit 55
- 45 Nassau Colony Unit 4
- 57 Vail Colony Unit 7
- 38672 N Beechwood Ave
- 38688 N Beechwood Ave
- 38660 N Beechwood Ave
- 38698 N Beechwood Ave
- 38722 N Beechwood Ave
- 38687 N Beechwood Ave
- 38644 N Beechwood Ave
- 38661 N Beechwood Ave
- 38732 N Beechwood Ave
- 38675 N Beechwood Ave
- 38667 N Beechwood Ave
- 38622 N Beechwood Ave
- 38735 N Beechwood Ave
- 38746 N Beechwood Ave
- 38633 N Beechwood Ave
- 38743 N Beechwood Ave
- 38606 N Beechwood Ave
- 38747 N Beechwood Ave
- 976 E Shore Dr
- 38605 N Beechwood Ave