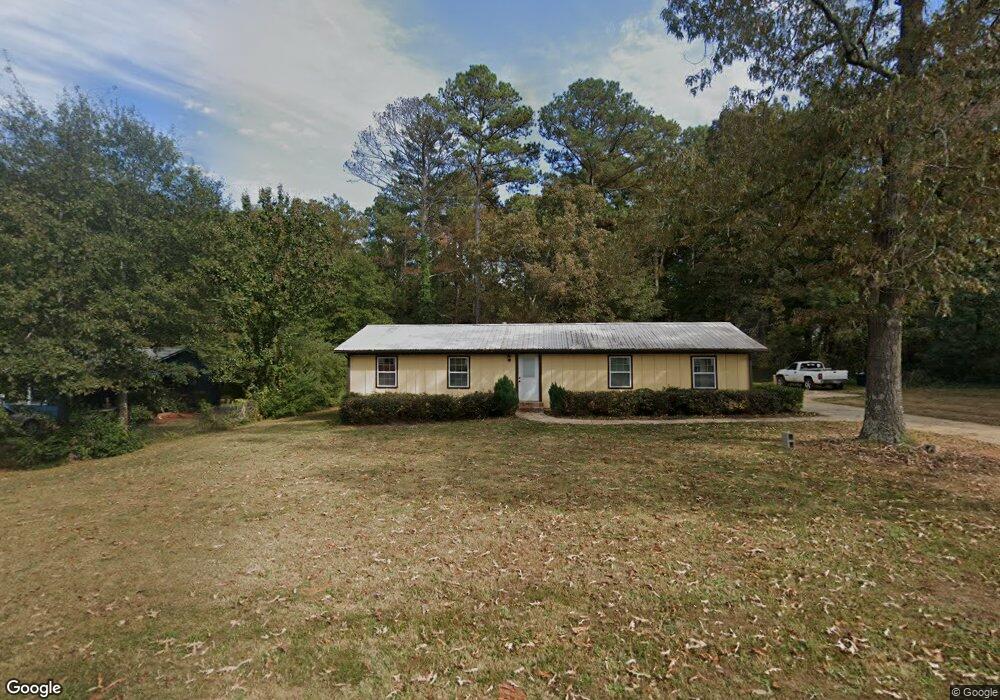
3868 Maggie Dr SE Conyers, GA 30013
Estimated Value: $198,000 - $274,000
3
Beds
2
Baths
1,086
Sq Ft
$209/Sq Ft
Est. Value
About This Home
This home is located at 3868 Maggie Dr SE, Conyers, GA 30013 and is currently estimated at $227,417, approximately $209 per square foot. 3868 Maggie Dr SE is a home located in Rockdale County with nearby schools including Barksdale Elementary School, Memorial Middle School, and Salem High School.
Ownership History
Date
Name
Owned For
Owner Type
Purchase Details
Closed on
Apr 23, 2018
Sold by
Cook Anthony William
Bought by
Savinon Andres Vergara
Current Estimated Value
Purchase Details
Closed on
May 28, 2010
Sold by
Wooten Jerry D
Bought by
Cook Anthony W and Cook Mistti W
Purchase Details
Closed on
Jan 20, 2010
Sold by
Ffmlt Trust 2005-Ff11
Bought by
Wooten Jerry D
Purchase Details
Closed on
Oct 6, 2009
Sold by
Ramirez Raul D
Bought by
Ffmlt Trust 2005-Ff11
Purchase Details
Closed on
Aug 5, 2005
Sold by
Duren Brenda L
Bought by
Ramirez Raul D
Home Financials for this Owner
Home Financials are based on the most recent Mortgage that was taken out on this home.
Original Mortgage
$68,000
Interest Rate
6.88%
Mortgage Type
New Conventional
Purchase Details
Closed on
Feb 29, 1996
Sold by
Sec Hud
Bought by
Duren Brenda
Purchase Details
Closed on
Nov 7, 1995
Sold by
Source One Mortgage Services Corp
Bought by
Sec Hud
Create a Home Valuation Report for This Property
The Home Valuation Report is an in-depth analysis detailing your home's value as well as a comparison with similar homes in the area
Home Values in the Area
Average Home Value in this Area
Purchase History
| Date | Buyer | Sale Price | Title Company |
|---|---|---|---|
| Savinon Andres Vergara | $40,000 | -- | |
| Cook Anthony W | -- | -- | |
| Wooten Jerry D | $20,000 | -- | |
| Ffmlt Trust 2005-Ff11 | $29,400 | -- | |
| Ramirez Raul D | $85,000 | -- | |
| Duren Brenda | -- | -- | |
| Sec Hud | -- | -- | |
| Source One Mtgsvcs Corp | -- | -- |
Source: Public Records
Mortgage History
| Date | Status | Borrower | Loan Amount |
|---|---|---|---|
| Previous Owner | Ramirez Raul D | $68,000 | |
| Closed | Duren Brenda | $0 |
Source: Public Records
Tax History Compared to Growth
Tax History
| Year | Tax Paid | Tax Assessment Tax Assessment Total Assessment is a certain percentage of the fair market value that is determined by local assessors to be the total taxable value of land and additions on the property. | Land | Improvement |
|---|---|---|---|---|
| 2024 | $3,266 | $81,480 | $22,120 | $59,360 |
| 2023 | $3,062 | $74,280 | $22,120 | $52,160 |
| 2022 | $2,634 | $63,480 | $14,160 | $49,320 |
| 2021 | $2,080 | $50,200 | $8,920 | $41,280 |
| 2020 | $2,139 | $50,200 | $8,920 | $41,280 |
| 2019 | $1,697 | $37,800 | $5,800 | $32,000 |
| 2018 | $285 | $24,200 | $4,800 | $19,400 |
| 2017 | $185 | $20,880 | $4,000 | $16,880 |
| 2016 | $170 | $20,880 | $4,000 | $16,880 |
| 2015 | $105 | $18,600 | $2,400 | $16,200 |
| 2014 | $99 | $18,600 | $2,400 | $16,200 |
| 2013 | -- | $24,000 | $5,720 | $18,280 |
Source: Public Records
Map
Nearby Homes
- 3841 Maggie Ct SE
- 3661 Cherry Creek Dr SE Unit 1
- 1388 Caritas Ct SE
- 3960 Highway 20 SE
- 2423 Scarlet Ln SE
- 958 Sweet Briar Trail SE
- 920 Sugar Creek Dr SE
- 4195 Stephanie Cir SE
- 1828 Brandy Woods Dr SE
- 4217 SE Lindsey Way
- 1332 Wild Rose Dr SE
- 864 Sweet Briar Ln SE
- 1311 N Brandy Shoals SE
- 610 Camary Ct SE
- 1790 Brandy Woods Trail SE
- 781 Sweet Briar Trail SE
- 3854 Maggie Dr SE
- 3884 Maggie Dr SE
- 3861 Maggie Ct SE
- 0 Maggie Dr SE Unit 9034818
- 0 Maggie Dr SE Unit 3262925
- 0 Maggie Dr SE Unit 3272078
- 0 Maggie Dr SE Unit 8108516
- 0 Maggie Dr SE Unit 8152326
- 0 Maggie Dr SE Unit 8677622
- 0 Maggie Dr SE Unit 18
- 3873 Maggie Ct SE
- 3891 Maggie Ct SE
- 3844 Maggie Dr SE
- 3851 Maggie Ct SE
- 3865 Maggie Dr SE
- 3885 Maggie Dr SE
- 3875 Maggie Dr SE
- 3855 Maggie Dr SE
- 2969 Christian Cir SE
- 3834 Maggie Dr SE