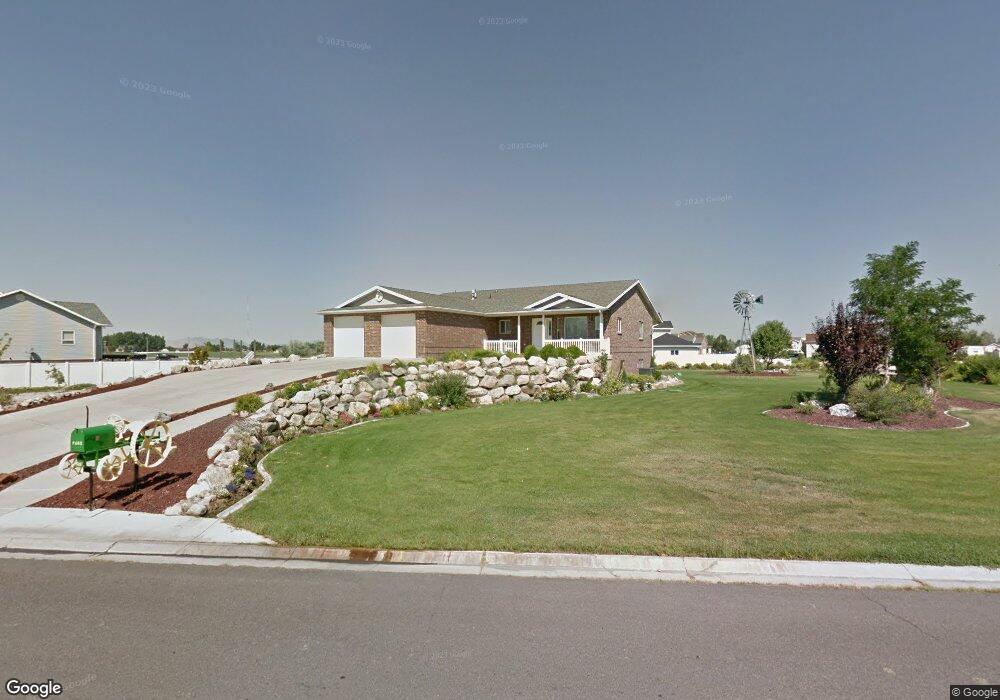
3868 W 4350 S West Haven, UT 84401
Estimated Value: $715,000 - $854,000
4
Beds
4
Baths
1,945
Sq Ft
$413/Sq Ft
Est. Value
About This Home
This home is located at 3868 W 4350 S, West Haven, UT 84401 and is currently estimated at $803,263, approximately $412 per square foot. 3868 W 4350 S is a home located in Weber County with nearby schools including West Haven School, Sand Ridge Junior High School, and Roy High School.
Ownership History
Date
Name
Owned For
Owner Type
Purchase Details
Closed on
Dec 11, 2024
Sold by
Warner Mark Anthony
Bought by
Mark A Warner Living Trust and Warner
Current Estimated Value
Purchase Details
Closed on
Feb 4, 2022
Sold by
Anthony Warner Mark
Bought by
Warner Mark Anthony and Klug Markey J
Home Financials for this Owner
Home Financials are based on the most recent Mortgage that was taken out on this home.
Original Mortgage
$380,000
Interest Rate
3.55%
Mortgage Type
New Conventional
Purchase Details
Closed on
Apr 8, 2011
Sold by
Farr Wynn M
Bought by
Farr Wynn M and Farr Dianna P
Purchase Details
Closed on
Dec 9, 2010
Sold by
The Darrell & Melva Page Family Trust and Page Darrell R
Bought by
Farr Wynn M and Farr Dianna P
Purchase Details
Closed on
Jan 6, 2000
Sold by
Northern Regal Homes Inc
Bought by
Page Darrell R and Page Melva O
Create a Home Valuation Report for This Property
The Home Valuation Report is an in-depth analysis detailing your home's value as well as a comparison with similar homes in the area
Home Values in the Area
Average Home Value in this Area
Purchase History
| Date | Buyer | Sale Price | Title Company |
|---|---|---|---|
| Mark A Warner Living Trust | -- | None Listed On Document | |
| Warner Mark Anthony | -- | First American Title | |
| Warner Mark Anthony | -- | None Listed On Document | |
| Farr Wynn M | -- | None Available | |
| Farr Wynn M | -- | None Available | |
| Farr Wynn M | -- | First American Fashion Point | |
| Page Darrell R | -- | Mountain View Title | |
| Northern Regal Homes Inc | -- | Mountain View Title |
Source: Public Records
Mortgage History
| Date | Status | Borrower | Loan Amount |
|---|---|---|---|
| Previous Owner | Warner Mark Anthony | $380,000 |
Source: Public Records
Tax History Compared to Growth
Tax History
| Year | Tax Paid | Tax Assessment Tax Assessment Total Assessment is a certain percentage of the fair market value that is determined by local assessors to be the total taxable value of land and additions on the property. | Land | Improvement |
|---|---|---|---|---|
| 2025 | $4,950 | $756,049 | $180,009 | $576,040 |
| 2024 | $4,709 | $408,098 | $99,004 | $309,094 |
| 2023 | $4,739 | $415,249 | $99,005 | $316,244 |
| 2022 | $4,901 | $443,300 | $99,005 | $344,295 |
| 2021 | $4,210 | $633,000 | $94,243 | $538,757 |
| 2020 | $3,915 | $547,000 | $79,915 | $467,085 |
| 2019 | $3,982 | $535,999 | $80,099 | $455,900 |
| 2018 | $4,080 | $535,001 | $74,017 | $460,984 |
| 2017 | $3,478 | $436,000 | $74,078 | $361,922 |
| 2016 | $3,112 | $212,150 | $32,323 | $179,827 |
| 2015 | $3,015 | $203,587 | $32,323 | $171,264 |
| 2014 | $2,684 | $177,086 | $26,854 | $150,232 |
Source: Public Records
Map
Nearby Homes
- 4357 S 3700 W
- Villages Townhome Plan at Green Farm - Villages
- 4643 S 3900 W
- 3692 W 4625 S
- 4045 S 3600 W
- 3542 W 4200 S
- 3652 W 4625 S
- 3669 W 4625 S
- 4124 S 3560 W
- 3984 W 4000 S
- 3554 W 4100 S Unit 63
- 3651 W 4625 S
- 3632 W 4650 S
- 3941 S 3850 W
- 4080 W 4000 S
- 3627 W 4650 S
- 3679 W 4700 S
- 3671 W 4700 S
- 4666 S 3600 W
- 4094 W 4700 S
- 3868 W 4350 S
- 4275 S 3850 W
- 4396 S 3850 W
- 4354 S 3850 W
- 4355 S 3850 W
- 3888 W 4350 S
- 3888 W 4350 S Unit 34
- 4352 S 3850 W
- 4352 S 3875 W Unit 39
- 4292 S 3850 W
- 4351 S 3875 W
- 4351 S 3850 W
- 4259 S 3850 W
- 3809 W 4300 S
- 3808 W 4300 S
- 4256 S 3850 W
- 4240 S 3850 W
- 4356 S 3850 W
- 4356 S 3875 W Unit 37
- 4356 S 3875 W