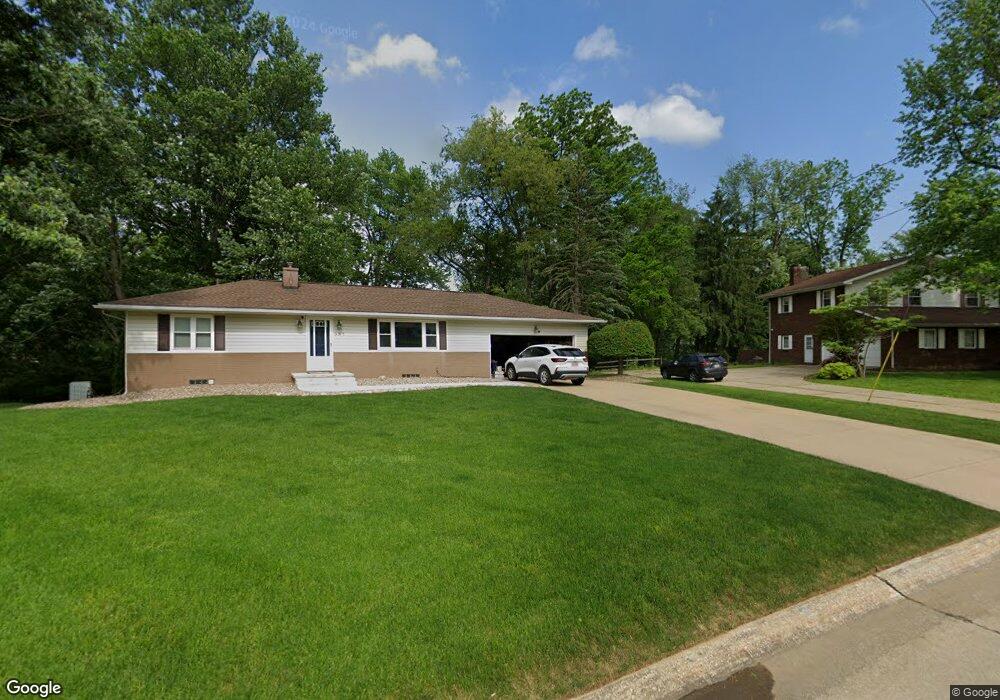
387 Beaumont Dr Fairlawn, OH 44333
Estimated Value: $237,302 - $260,000
3
Beds
1
Bath
1,134
Sq Ft
$221/Sq Ft
Est. Value
About This Home
This home is located at 387 Beaumont Dr, Fairlawn, OH 44333 and is currently estimated at $250,576, approximately $220 per square foot. 387 Beaumont Dr is a home located in Summit County with nearby schools including Copley-Fairlawn Middle School, Copley High School, and Fairlawn Lutheran School.
Ownership History
Date
Name
Owned For
Owner Type
Purchase Details
Closed on
Jan 28, 2021
Sold by
Herstich Justin E and Herstich Amy
Bought by
Herstich Justin E and Herstich Amy
Current Estimated Value
Home Financials for this Owner
Home Financials are based on the most recent Mortgage that was taken out on this home.
Original Mortgage
$107,500
Outstanding Balance
$78,163
Interest Rate
2.1%
Mortgage Type
New Conventional
Estimated Equity
$172,413
Purchase Details
Closed on
May 1, 2008
Sold by
Matz Dolores Jean
Bought by
Herstich Justin E
Home Financials for this Owner
Home Financials are based on the most recent Mortgage that was taken out on this home.
Original Mortgage
$126,100
Interest Rate
5.88%
Mortgage Type
Purchase Money Mortgage
Purchase Details
Closed on
Jun 13, 2007
Sold by
Black Mary E
Bought by
Black Mary E
Purchase Details
Closed on
Feb 13, 2006
Sold by
Black Mary E
Bought by
Matz Dolores and Kungle Kenneth
Create a Home Valuation Report for This Property
The Home Valuation Report is an in-depth analysis detailing your home's value as well as a comparison with similar homes in the area
Home Values in the Area
Average Home Value in this Area
Purchase History
| Date | Buyer | Sale Price | Title Company |
|---|---|---|---|
| Herstich Justin E | -- | None Listed On Document | |
| Herstich Justin E | $130,000 | Chicago Title Insurance Co | |
| Black Mary E | -- | Attorney | |
| Matz Dolores | -- | None Available |
Source: Public Records
Mortgage History
| Date | Status | Borrower | Loan Amount |
|---|---|---|---|
| Open | Herstich Justin E | $107,500 | |
| Previous Owner | Herstich Justin E | $126,100 |
Source: Public Records
Tax History Compared to Growth
Tax History
| Year | Tax Paid | Tax Assessment Tax Assessment Total Assessment is a certain percentage of the fair market value that is determined by local assessors to be the total taxable value of land and additions on the property. | Land | Improvement |
|---|---|---|---|---|
| 2025 | $2,705 | $67,978 | $19,086 | $48,892 |
| 2024 | $2,705 | $67,978 | $19,086 | $48,892 |
| 2023 | $2,705 | $67,978 | $19,086 | $48,892 |
| 2022 | $2,442 | $50,729 | $14,350 | $36,379 |
| 2021 | $2,294 | $50,729 | $14,350 | $36,379 |
| 2020 | $2,243 | $50,730 | $14,350 | $36,380 |
| 2019 | $2,350 | $47,640 | $14,880 | $32,760 |
| 2018 | $2,303 | $47,640 | $14,880 | $32,760 |
| 2017 | $2,286 | $47,640 | $14,880 | $32,760 |
| 2016 | $2,285 | $44,330 | $14,880 | $29,450 |
| 2015 | $2,286 | $44,330 | $14,880 | $29,450 |
| 2014 | $2,278 | $44,330 | $14,880 | $29,450 |
| 2013 | $2,276 | $44,410 | $14,880 | $29,530 |
Source: Public Records
Map
Nearby Homes
- 360 Marviel Dr
- 3143 Morewood Rd
- 3354 Bancroft Rd
- 462 Gresham Dr
- 3340 Willow Ln
- 482 Gresham Dr
- 278 Chestnut Ln
- 3404 S Smith Rd
- 1012 Bunker Dr Unit 304
- 3317 Morewood Rd
- 242 Elm Ln
- 3475 Bancroft Rd
- 600 White Tail Ridge Dr
- 3451 Stanley Rd
- 3430 Links Dr
- 288 Kenridge Rd
- 0 Brunsdorph Rd
- V/L White Tail Ridge Dr
- 3571 Bay Hill Dr
- 3584 Bay Hill Dr
- 395 Beaumont Dr
- 377 Beaumont Dr
- 3210 Bancroft Rd
- 405 Beaumont Dr
- 3202 Bancroft Rd
- 382 Beaumont Dr
- 3218 Bancroft Rd
- 369 Beaumont Dr
- 400 Beaumont Dr
- 411 Beaumont Dr
- 364 Beaumont Dr
- 415 Beaumont Dr
- 3228 Bancroft Rd
- 3194 Bancroft Rd
- 3171 Edington Rd
- 361 Beaumont Dr
- 414 Beaumont Dr
- 3224 Elgin Dr
- 3217 Edington Rd
- 3203 Bancroft Rd