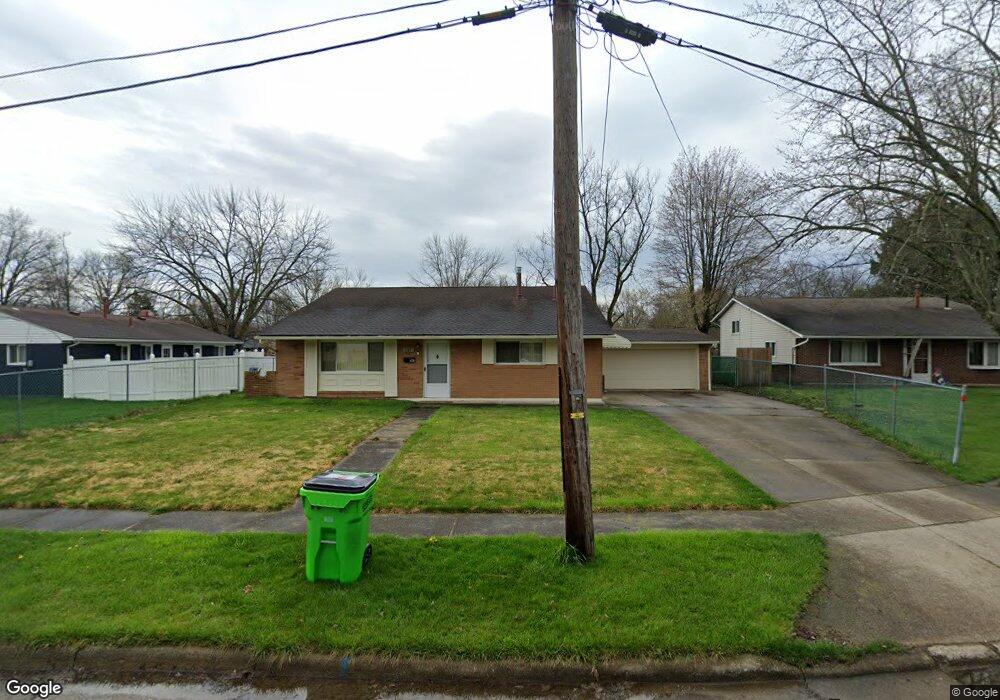
387 Charring Cross Cir Munroe Falls, OH 44262
Estimated Value: $208,000 - $271,000
3
Beds
2
Baths
1,140
Sq Ft
$221/Sq Ft
Est. Value
About This Home
This home is located at 387 Charring Cross Cir, Munroe Falls, OH 44262 and is currently estimated at $251,682, approximately $220 per square foot. 387 Charring Cross Cir is a home located in Summit County with nearby schools including Stow-Munroe Falls High School, Holy Family Elementary School, and Walsh Jesuit High School.
Ownership History
Date
Name
Owned For
Owner Type
Purchase Details
Closed on
Apr 13, 2012
Sold by
Brentom Ltd
Bought by
Dwenger Kevin L and Dwenger Jennie M
Current Estimated Value
Home Financials for this Owner
Home Financials are based on the most recent Mortgage that was taken out on this home.
Original Mortgage
$76,560
Outstanding Balance
$52,906
Interest Rate
3.92%
Mortgage Type
New Conventional
Estimated Equity
$198,776
Purchase Details
Closed on
Nov 16, 2011
Sold by
Estate Of Glenna M Romonchuk
Bought by
Bren Tom Ltd
Purchase Details
Closed on
May 7, 2001
Sold by
Romonchuk William T
Bought by
Romonchuk William T and Romonchuk Glenna M
Create a Home Valuation Report for This Property
The Home Valuation Report is an in-depth analysis detailing your home's value as well as a comparison with similar homes in the area
Home Values in the Area
Average Home Value in this Area
Purchase History
| Date | Buyer | Sale Price | Title Company |
|---|---|---|---|
| Dwenger Kevin L | $95,700 | Quest Title Agency | |
| Bren Tom Ltd | $95,700 | Northstar Title | |
| Romonchuk William T | -- | -- |
Source: Public Records
Mortgage History
| Date | Status | Borrower | Loan Amount |
|---|---|---|---|
| Open | Dwenger Kevin L | $76,560 |
Source: Public Records
Tax History Compared to Growth
Tax History
| Year | Tax Paid | Tax Assessment Tax Assessment Total Assessment is a certain percentage of the fair market value that is determined by local assessors to be the total taxable value of land and additions on the property. | Land | Improvement |
|---|---|---|---|---|
| 2025 | $3,596 | $64,712 | $12,600 | $52,112 |
| 2024 | $3,596 | $64,712 | $12,600 | $52,112 |
| 2023 | $3,596 | $64,712 | $12,600 | $52,112 |
| 2022 | $3,435 | $53,481 | $10,413 | $43,068 |
| 2021 | $2,981 | $53,481 | $10,413 | $43,068 |
| 2020 | $2,929 | $53,480 | $10,410 | $43,070 |
| 2019 | $2,777 | $46,750 | $9,190 | $37,560 |
| 2018 | $2,732 | $46,750 | $9,190 | $37,560 |
| 2017 | $2,412 | $46,750 | $9,190 | $37,560 |
| 2016 | $2,576 | $43,250 | $9,190 | $34,060 |
| 2015 | $2,412 | $43,250 | $9,190 | $34,060 |
| 2014 | $2,374 | $42,240 | $9,190 | $33,050 |
| 2013 | $2,305 | $38,850 | $9,190 | $29,660 |
Source: Public Records
Map
Nearby Homes
- 400 Cathy Dr
- 1974 Hawthorne Ave
- 64 River Ridge Ln Unit H64
- 82 Silver Valley Blvd Unit B82
- 100 Trudy Ave
- 3642 Northport Dr
- 3366 Darrow Rd
- 2584 Peach Tree Cir
- 3383 Suffolk Downs
- 3560 Orchard Dr Unit A22
- 1861 Gorge Park Blvd
- 3791 Baird Rd
- 3359 Churchill Downs
- 3679 Sanford Ave
- 3070 Kent Rd
- 3070 Kent Rd Unit 502
- 3128 Bay Meadows Cir
- 3619 Williamson Rd
- 3511 Whit Ave
- 134 S Main St Unit B11
- 389 Charring Cir
- 385 Charring Cross Dr
- 389 Charring Cross Cir
- 383 Charring Cross Dr
- 391 Charring Cross Cir
- 391 Charring Cir
- 396 Charring Cross Cir
- 401 Charring Cross Dr
- 290 Phillips Ave
- 392 Charring Cross Cir
- 386 Charring Cross Dr
- 310 Phillips Ave
- 384 Charring Cross Dr
- 388 Charring Cross Dr
- 294 Phillips Ave
- 394 Cathy Dr
- 286 Phillips Ave
- 394 Charring Cross Cir
- 400 Charring Cross Dr
- 390 Cathy Dr