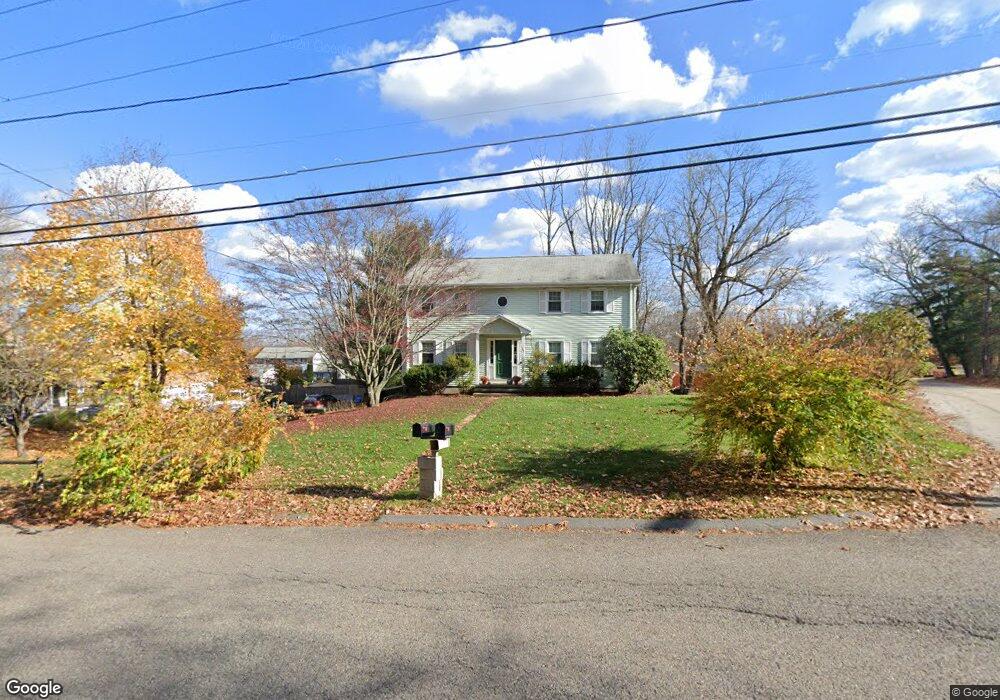
387 Dennison Dr Southbridge, MA 01550
Estimated Value: $317,000 - $351,000
5
Beds
4
Baths
2,028
Sq Ft
$167/Sq Ft
Est. Value
About This Home
This home is located at 387 Dennison Dr, Southbridge, MA 01550 and is currently estimated at $337,917, approximately $166 per square foot. 387 Dennison Dr is a home located in Worcester County with nearby schools including Trinity Catholic Academy and ViewPoint Christian Academy.
Ownership History
Date
Name
Owned For
Owner Type
Purchase Details
Closed on
Jun 27, 2025
Sold by
Lundstrom Glen E and Lundstrom Keith E
Bought by
Lundstrom Timothy
Current Estimated Value
Home Financials for this Owner
Home Financials are based on the most recent Mortgage that was taken out on this home.
Original Mortgage
$25,000
Outstanding Balance
$24,958
Interest Rate
6.89%
Mortgage Type
Second Mortgage Made To Cover Down Payment
Estimated Equity
$312,959
Purchase Details
Closed on
Apr 28, 2006
Sold by
Lundstrom Joann M
Bought by
Lundstrom Glen E and Lundstrom Keith R
Create a Home Valuation Report for This Property
The Home Valuation Report is an in-depth analysis detailing your home's value as well as a comparison with similar homes in the area
Home Values in the Area
Average Home Value in this Area
Purchase History
| Date | Buyer | Sale Price | Title Company |
|---|---|---|---|
| Lundstrom Timothy | $335,000 | -- | |
| Lundstrom Timothy | $335,000 | -- | |
| Lundstrom Glen E | -- | -- | |
| Lundstrom Glen E | -- | -- |
Source: Public Records
Mortgage History
| Date | Status | Borrower | Loan Amount |
|---|---|---|---|
| Open | Lundstrom Timothy | $25,000 | |
| Closed | Lundstrom Timothy | $25,000 | |
| Previous Owner | Lundstrom Glen E | $10,000 | |
| Previous Owner | Lundstrom Glen E | $25,000 |
Source: Public Records
Tax History Compared to Growth
Tax History
| Year | Tax Paid | Tax Assessment Tax Assessment Total Assessment is a certain percentage of the fair market value that is determined by local assessors to be the total taxable value of land and additions on the property. | Land | Improvement |
|---|---|---|---|---|
| 2025 | $5,061 | $345,200 | $41,000 | $304,200 |
| 2024 | $4,378 | $286,900 | $34,100 | $252,800 |
| 2023 | $4,125 | $260,400 | $34,100 | $226,300 |
| 2022 | $3,908 | $218,300 | $29,200 | $189,100 |
| 2021 | $3,488 | $179,400 | $29,200 | $150,200 |
| 2020 | $3,228 | $165,700 | $29,200 | $136,500 |
| 2018 | $3,081 | $148,500 | $29,200 | $119,300 |
| 2017 | $2,841 | $138,100 | $29,200 | $108,900 |
| 2016 | $2,791 | $138,100 | $29,200 | $108,900 |
| 2015 | $3,166 | $155,500 | $29,200 | $126,300 |
| 2014 | $3,054 | $155,500 | $29,200 | $126,300 |
Source: Public Records
Map
Nearby Homes