Estimated Value: $456,000 - $486,000
3
Beds
1
Bath
1,068
Sq Ft
$437/Sq Ft
Est. Value
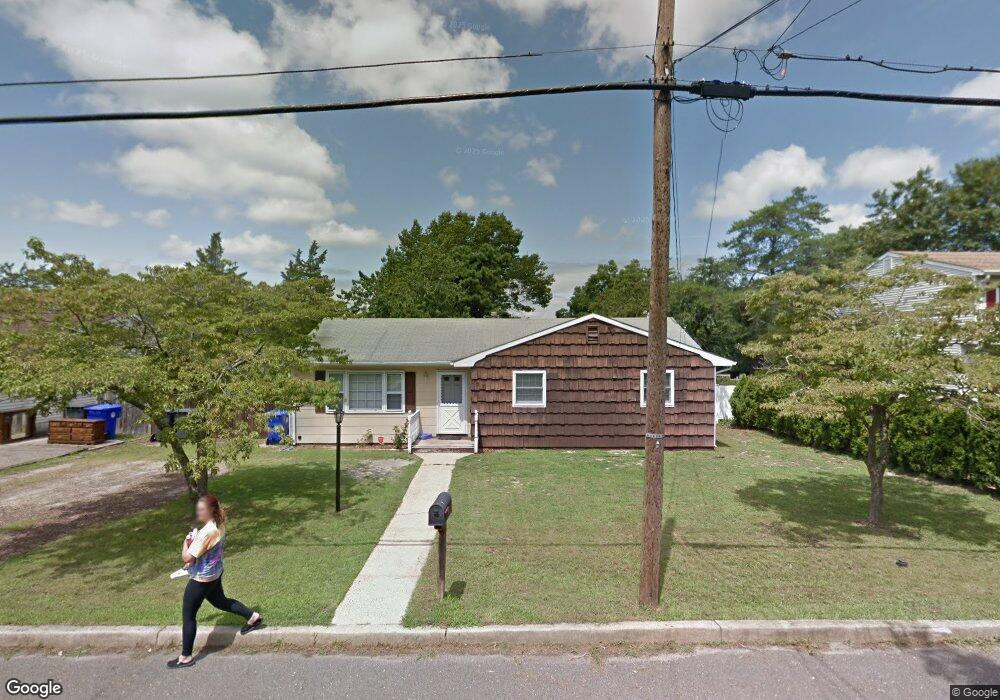
About This Home
This home is located at 387 Harper Ave, Brick, NJ 08724 and is currently estimated at $466,455, approximately $436 per square foot. 387 Harper Ave is a home located in Ocean County with nearby schools including Veterans Memorial Elementary School, Veterans Memorial Middle School, and Brick Township Memorial High School.
Ownership History
Date
Name
Owned For
Owner Type
Purchase Details
Closed on
May 10, 2004
Sold by
Newmeyer Michael F
Bought by
Hansen Lance and Hansen Lori
Current Estimated Value
Home Financials for this Owner
Home Financials are based on the most recent Mortgage that was taken out on this home.
Original Mortgage
$177,600
Outstanding Balance
$83,093
Interest Rate
5.47%
Mortgage Type
Fannie Mae Freddie Mac
Estimated Equity
$383,362
Create a Home Valuation Report for This Property
The Home Valuation Report is an in-depth analysis detailing your home's value as well as a comparison with similar homes in the area
Home Values in the Area
Average Home Value in this Area
Purchase History
| Date | Buyer | Sale Price | Title Company |
|---|---|---|---|
| Hansen Lance | $222,000 | None Available |
Source: Public Records
Mortgage History
| Date | Status | Borrower | Loan Amount |
|---|---|---|---|
| Open | Hansen Lance | $177,600 |
Source: Public Records
Tax History
| Year | Tax Paid | Tax Assessment Tax Assessment Total Assessment is a certain percentage of the fair market value that is determined by local assessors to be the total taxable value of land and additions on the property. | Land | Improvement |
|---|---|---|---|---|
| 2025 | $5,845 | $223,500 | $141,200 | $82,300 |
| 2024 | $5,556 | $223,500 | $141,200 | $82,300 |
Source: Public Records
Map
Nearby Homes
- 432 18th Ave
- 295 Madison Ct
- 393 N Lake Dr
- 441 17th Ave
- 339 Prospect Dr
- 823 Maple Ave
- 869 Koches Ave Unit 18
- 506 Azalea Dr
- 178 Calvin Ct
- 505 5th Ave
- 22 Cedar Village Blvd
- 531 Azalea Dr
- 257 Riverside Dr N
- 15 Brandywine Ct
- 516 Driscol Dr
- 1 Drury Ct
- 124 Roosevelt Dr
- 151 Riverside Dr N
- 18 Northrup Dr Unit 201
- 48 Northrup Dr Unit 196
Your Personal Tour Guide
Ask me questions while you tour the home.