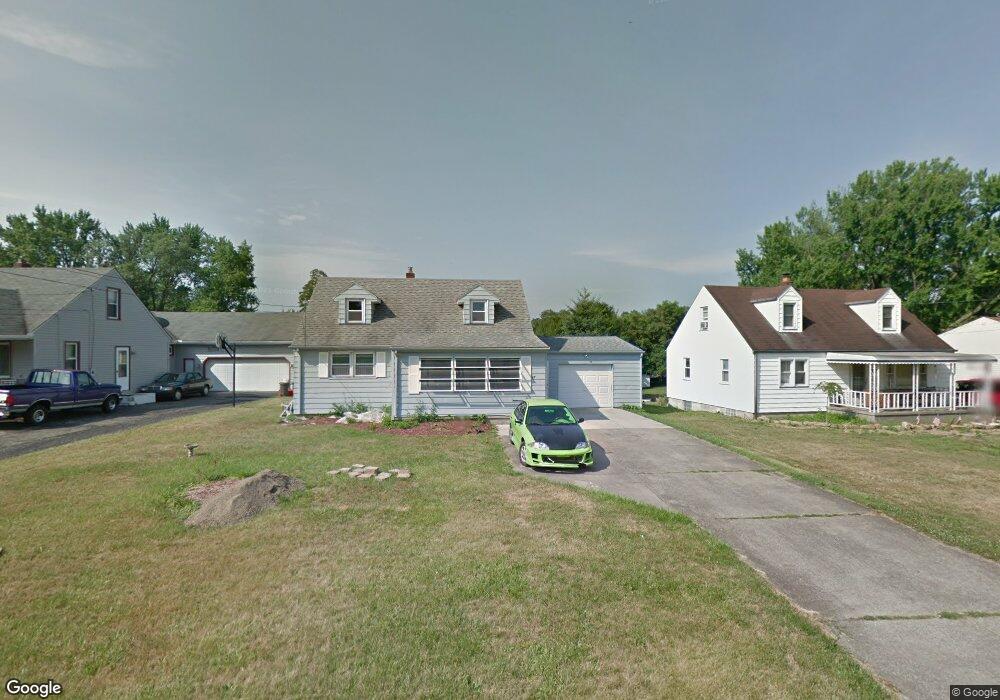
387 Jackson St Campbell, OH 44405
Estimated Value: $98,000 - $126,000
3
Beds
2
Baths
1,137
Sq Ft
$102/Sq Ft
Est. Value
About This Home
This home is located at 387 Jackson St, Campbell, OH 44405 and is currently estimated at $115,922, approximately $101 per square foot. 387 Jackson St is a home located in Mahoning County with nearby schools including Campbell Elementary School, Northeast Ohio Impact Academy, and Memorial High School.
Ownership History
Date
Name
Owned For
Owner Type
Purchase Details
Closed on
Nov 2, 2023
Sold by
Casey Kathryn L
Bought by
Klc Company Llc
Current Estimated Value
Purchase Details
Closed on
Sep 20, 2010
Sold by
Deutsche Bank National Trust Company
Bought by
Casey Kathryn L
Purchase Details
Closed on
Jun 14, 2010
Sold by
Ruiz Francisco
Bought by
Deutsche Bank National Trust Company
Purchase Details
Closed on
Jan 25, 2006
Sold by
Sudzina Michael and Sudzina Carol
Bought by
Ruiz Francisco and Ruiz Michelle
Home Financials for this Owner
Home Financials are based on the most recent Mortgage that was taken out on this home.
Original Mortgage
$66,300
Interest Rate
9.82%
Mortgage Type
Fannie Mae Freddie Mac
Purchase Details
Closed on
Nov 15, 1965
Bought by
Sudzina Mike and Sudzina Mary
Create a Home Valuation Report for This Property
The Home Valuation Report is an in-depth analysis detailing your home's value as well as a comparison with similar homes in the area
Home Values in the Area
Average Home Value in this Area
Purchase History
| Date | Buyer | Sale Price | Title Company |
|---|---|---|---|
| Klc Company Llc | -- | None Listed On Document | |
| Casey Kathryn L | $8,000 | None Available | |
| Deutsche Bank National Trust Company | $44,000 | None Available | |
| Ruiz Francisco | $78,000 | None Available | |
| Sudzina Mike | -- | -- |
Source: Public Records
Mortgage History
| Date | Status | Borrower | Loan Amount |
|---|---|---|---|
| Previous Owner | Ruiz Francisco | $66,300 |
Source: Public Records
Tax History Compared to Growth
Tax History
| Year | Tax Paid | Tax Assessment Tax Assessment Total Assessment is a certain percentage of the fair market value that is determined by local assessors to be the total taxable value of land and additions on the property. | Land | Improvement |
|---|---|---|---|---|
| 2024 | $1,336 | $24,890 | $3,150 | $21,740 |
| 2023 | $1,320 | $24,890 | $3,150 | $21,740 |
| 2022 | $1,209 | $19,070 | $3,160 | $15,910 |
| 2021 | $1,134 | $19,070 | $3,160 | $15,910 |
| 2020 | $1,152 | $19,070 | $3,160 | $15,910 |
| 2019 | $1,145 | $16,870 | $2,790 | $14,080 |
| 2018 | $1,173 | $16,870 | $2,790 | $14,080 |
| 2017 | $1,170 | $16,870 | $2,790 | $14,080 |
| 2016 | $1,090 | $16,690 | $3,180 | $13,510 |
| 2015 | $1,070 | $16,690 | $3,180 | $13,510 |
| 2014 | $1,066 | $16,690 | $3,180 | $13,510 |
| 2013 | $1,046 | $16,690 | $3,180 | $13,510 |
Source: Public Records
Map
Nearby Homes
- 3307 Upland Ave
- 77 Wilhelm St
- 90 Frank St
- 247 Reed Ave
- 115 Madison St
- 111 Madison St
- 683 Robinson Rd
- 640 Matawan Ave
- 291 Struthers Liberty Rd
- 680 Tenney Ave
- 0 Oakview Ave
- 664 Tenney Ave
- 853 Almasy Dr
- 805 Devitt Ave
- 0 Harding St
- 102 Bright Ave
- 746 Whipple Ave
- 1035 Struthers Coitsville Rd
- 459 Tenney Ave
- 0 Penhale Ave