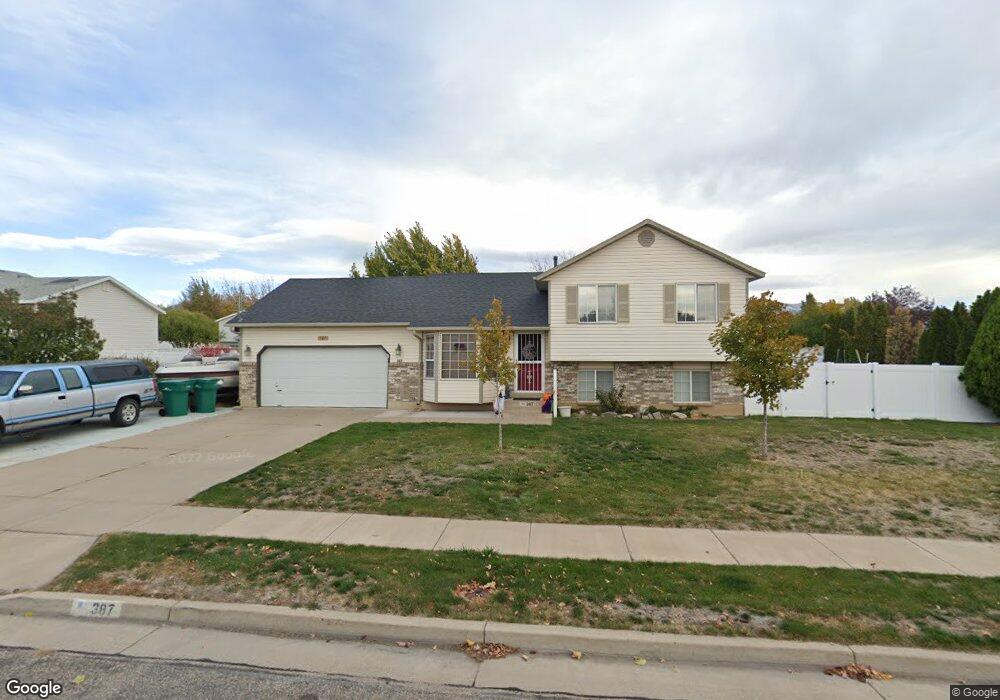
387 N 500 W Clearfield, UT 84015
Estimated Value: $400,000 - $439,000
4
Beds
2
Baths
1,570
Sq Ft
$266/Sq Ft
Est. Value
About This Home
This home is located at 387 N 500 W, Clearfield, UT 84015 and is currently estimated at $417,968, approximately $266 per square foot. 387 N 500 W is a home located in Davis County with nearby schools including Holt Elementary School, North Davis Junior High School, and Clearfield High School.
Ownership History
Date
Name
Owned For
Owner Type
Purchase Details
Closed on
Apr 30, 2019
Sold by
Noy Thomas J Van
Bought by
Sadia Patterson Robert and Sadia Montaha
Current Estimated Value
Home Financials for this Owner
Home Financials are based on the most recent Mortgage that was taken out on this home.
Original Mortgage
$235,653
Outstanding Balance
$212,451
Interest Rate
5.75%
Mortgage Type
FHA
Estimated Equity
$205,517
Purchase Details
Closed on
Mar 26, 2012
Sold by
Drake Ronald Joe and Drake Sharon L
Bought by
Vannoy Thomas J
Home Financials for this Owner
Home Financials are based on the most recent Mortgage that was taken out on this home.
Original Mortgage
$8,790
Interest Rate
3.91%
Mortgage Type
Stand Alone Second
Purchase Details
Closed on
Oct 17, 2006
Sold by
Drake Ronald Joe
Bought by
Drake Ronald Joe and Drake Sharon L
Purchase Details
Closed on
May 27, 2004
Sold by
Siripathane Sanpaly
Bought by
Drake Ronald Joe
Home Financials for this Owner
Home Financials are based on the most recent Mortgage that was taken out on this home.
Original Mortgage
$121,395
Interest Rate
5.86%
Mortgage Type
FHA
Purchase Details
Closed on
May 5, 2004
Sold by
Castro Jose D and Siripathane Sanpaly
Bought by
Siripathane Sanpaly
Home Financials for this Owner
Home Financials are based on the most recent Mortgage that was taken out on this home.
Original Mortgage
$121,395
Interest Rate
5.86%
Mortgage Type
FHA
Purchase Details
Closed on
Jun 9, 1997
Sold by
Higley Dennis R
Bought by
Castro Jose D and Siripathane Sanpaly
Home Financials for this Owner
Home Financials are based on the most recent Mortgage that was taken out on this home.
Original Mortgage
$104,330
Interest Rate
7.98%
Mortgage Type
FHA
Purchase Details
Closed on
Jun 4, 1997
Sold by
Higley Vickie L
Bought by
Higley Dennis R and Dhi Construction Trust
Home Financials for this Owner
Home Financials are based on the most recent Mortgage that was taken out on this home.
Original Mortgage
$104,330
Interest Rate
7.98%
Mortgage Type
FHA
Create a Home Valuation Report for This Property
The Home Valuation Report is an in-depth analysis detailing your home's value as well as a comparison with similar homes in the area
Home Values in the Area
Average Home Value in this Area
Purchase History
| Date | Buyer | Sale Price | Title Company |
|---|---|---|---|
| Sadia Patterson Robert | -- | Synergy Title | |
| Vannoy Thomas J | -- | First American Title | |
| Drake Ronald Joe | -- | First American Title Ins Co | |
| Drake Ronald Joe | -- | First American Title Co | |
| Siripathane Sanpaly | -- | First American Title Co | |
| Castro Jose D | -- | Bonneville Title Company Inc | |
| Higley Dennis R | -- | Bonneville Title Company Inc |
Source: Public Records
Mortgage History
| Date | Status | Borrower | Loan Amount |
|---|---|---|---|
| Open | Sadia Patterson Robert | $235,653 | |
| Previous Owner | Vannoy Thomas J | $8,790 | |
| Previous Owner | Vannoy Thomas J | $147,970 | |
| Previous Owner | Drake Ronald Joe | $121,395 | |
| Previous Owner | Castro Jose D | $104,330 |
Source: Public Records
Tax History Compared to Growth
Tax History
| Year | Tax Paid | Tax Assessment Tax Assessment Total Assessment is a certain percentage of the fair market value that is determined by local assessors to be the total taxable value of land and additions on the property. | Land | Improvement |
|---|---|---|---|---|
| 2025 | $2,369 | $212,301 | $76,819 | $135,482 |
| 2024 | $2,291 | $206,800 | $73,380 | $133,420 |
| 2023 | $2,113 | $350,000 | $116,578 | $233,422 |
| 2022 | $2,277 | $204,050 | $65,953 | $138,097 |
| 2021 | $2,120 | $287,000 | $74,496 | $212,504 |
| 2020 | $1,830 | $246,000 | $63,491 | $182,509 |
| 2019 | $1,718 | $228,000 | $63,487 | $164,513 |
| 2018 | $1,554 | $201,000 | $56,352 | $144,648 |
| 2016 | $1,381 | $93,390 | $22,801 | $70,589 |
| 2015 | $1,305 | $84,095 | $22,801 | $61,294 |
| 2014 | $1,280 | $83,585 | $22,801 | $60,784 |
| 2013 | -- | $75,900 | $30,451 | $45,449 |
Source: Public Records
Map
Nearby Homes