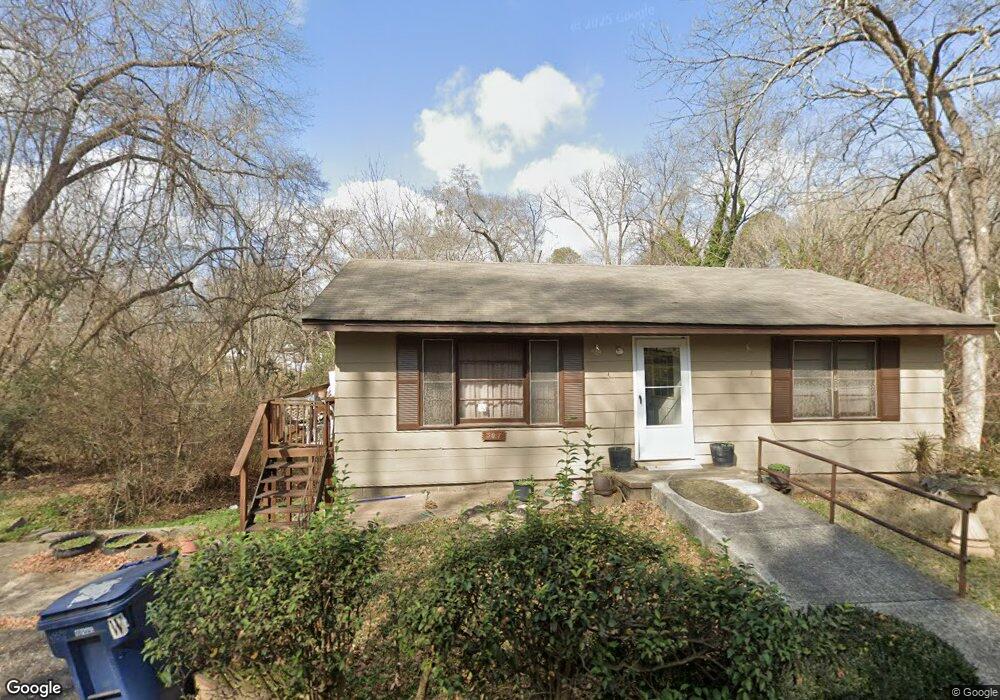
387 Odd St Athens, GA 30601
Chicopee-Dudley NeighborhoodEstimated Value: $171,000 - $343,000
--
Bed
--
Bath
936
Sq Ft
$262/Sq Ft
Est. Value
About This Home
This home is located at 387 Odd St, Athens, GA 30601 and is currently estimated at $245,232, approximately $262 per square foot. 387 Odd St is a home located in Clarke County with nearby schools including Howard B. Stroud Elementary School, Coile Middle School, and Cedar Shoals High School.
Create a Home Valuation Report for This Property
The Home Valuation Report is an in-depth analysis detailing your home's value as well as a comparison with similar homes in the area
Home Values in the Area
Average Home Value in this Area
Tax History Compared to Growth
Tax History
| Year | Tax Paid | Tax Assessment Tax Assessment Total Assessment is a certain percentage of the fair market value that is determined by local assessors to be the total taxable value of land and additions on the property. | Land | Improvement |
|---|---|---|---|---|
| 2024 | $2,444 | $73,035 | $33,412 | $39,623 |
| 2023 | $2,282 | $69,145 | $33,412 | $35,732 |
| 2022 | $711 | $52,358 | $28,066 | $24,292 |
| 2021 | $657 | $45,816 | $28,066 | $17,750 |
| 2020 | $628 | $43,723 | $28,066 | $15,657 |
| 2019 | $610 | $41,870 | $29,146 | $12,724 |
| 2018 | $605 | $41,478 | $29,146 | $12,332 |
| 2017 | $595 | $40,771 | $29,146 | $11,625 |
| 2016 | $595 | $40,770 | $29,145 | $11,624 |
| 2015 | $595 | $40,770 | $29,145 | $11,624 |
| 2014 | $595 | $40,770 | $29,146 | $11,625 |
Source: Public Records
Map
Nearby Homes
- 249 Fifth St
- 560 Rosa Nell Howard St
- 191 First St
- 185 First St
- 239 Madison Heights
- 472 First St
- 178 First St
- 320 First St
- 318 First St
- 211 North Ave Unit 1333
- 264 Moreland Ave
- 248 Ruth St
- 256 Ruth St
- 1295 E Broad St Unit C-1
- 239 Ruth St Unit 15
- 132 N Poplar St
- 600 Pulaski St
- 226 Vine St
- 131 E Broad St Unit 901
- 150 Mitchell St
- 427 Odd St
- 367 Odd St
- 367 Rosa Nell Howard St
- 386 Odd St
- 386 Rosa Nell Howard St
- 447 Rosa Nell Howard St
- 119 John St
- 162 John St
- 467 Odd St
- 360 Odd St
- 360 Rosa Nell Howard St
- 164 John St
- 376 Rosa Nell Howard St
- 300 Odd St
- 123 John St
- 123 Pearl St
- 336 Rosa Nell Howard St
- 130 Griffith St
- 127 John St
- 168 John St