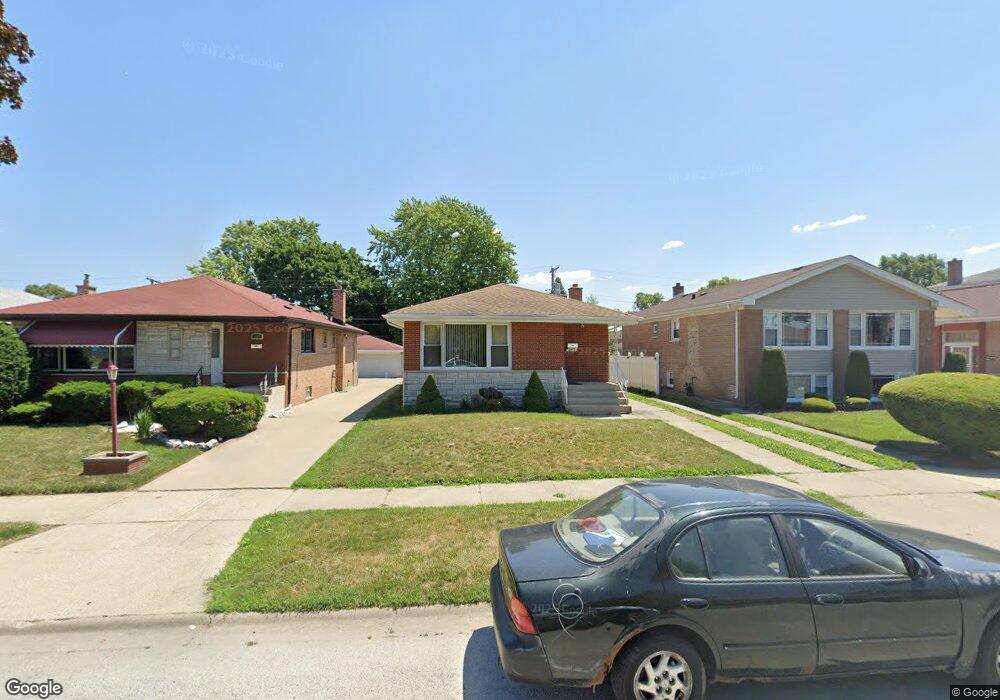
387 Oglesby Ave Calumet City, IL 60409
Estimated Value: $193,908 - $258,000
4
Beds
2
Baths
1,200
Sq Ft
$191/Sq Ft
Est. Value
About This Home
This home is located at 387 Oglesby Ave, Calumet City, IL 60409 and is currently estimated at $229,727, approximately $191 per square foot. 387 Oglesby Ave is a home located in Cook County with nearby schools including Caroline Sibley Elementary School, School Of Fine Arts Academy, and Creative Communications Academy.
Ownership History
Date
Name
Owned For
Owner Type
Purchase Details
Closed on
Oct 31, 2008
Sold by
Ars Capital Investments Llc
Bought by
Woods Kendrick and Masirnellie Checomsuh
Current Estimated Value
Home Financials for this Owner
Home Financials are based on the most recent Mortgage that was taken out on this home.
Original Mortgage
$164,930
Outstanding Balance
$108,318
Interest Rate
6.09%
Mortgage Type
FHA
Estimated Equity
$121,409
Purchase Details
Closed on
Dec 14, 2007
Sold by
The Bank Of New York Trust Co
Bought by
Ars Capital Investments Llc
Purchase Details
Closed on
Mar 19, 2007
Sold by
Randall Reginald
Bought by
The Bank Of New York Trust Co Na and Jp Morgan Chase Bank Na
Purchase Details
Closed on
Jun 2, 2003
Sold by
White Charles A and White Arlene F
Bought by
Randall Reginald
Home Financials for this Owner
Home Financials are based on the most recent Mortgage that was taken out on this home.
Original Mortgage
$141,500
Interest Rate
8.87%
Mortgage Type
Unknown
Create a Home Valuation Report for This Property
The Home Valuation Report is an in-depth analysis detailing your home's value as well as a comparison with similar homes in the area
Home Values in the Area
Average Home Value in this Area
Purchase History
| Date | Buyer | Sale Price | Title Company |
|---|---|---|---|
| Woods Kendrick | $167,000 | Pntn | |
| Ars Capital Investments Llc | $82,500 | First American Title | |
| The Bank Of New York Trust Co Na | -- | None Available | |
| Randall Reginald | $141,500 | Lawyers Title Insurance Corp |
Source: Public Records
Mortgage History
| Date | Status | Borrower | Loan Amount |
|---|---|---|---|
| Open | Woods Kendrick | $164,930 | |
| Previous Owner | Randall Reginald | $141,500 |
Source: Public Records
Tax History Compared to Growth
Tax History
| Year | Tax Paid | Tax Assessment Tax Assessment Total Assessment is a certain percentage of the fair market value that is determined by local assessors to be the total taxable value of land and additions on the property. | Land | Improvement |
|---|---|---|---|---|
| 2024 | $7,297 | $15,000 | $2,772 | $12,228 |
| 2023 | $6,233 | $15,000 | $2,772 | $12,228 |
| 2022 | $6,233 | $11,296 | $2,394 | $8,902 |
| 2021 | $5,938 | $11,295 | $2,394 | $8,901 |
| 2020 | $5,569 | $11,295 | $2,394 | $8,901 |
| 2019 | $4,591 | $9,649 | $2,016 | $7,633 |
| 2018 | $4,568 | $9,649 | $2,016 | $7,633 |
| 2017 | $4,421 | $9,649 | $2,016 | $7,633 |
| 2016 | $4,723 | $9,577 | $1,890 | $7,687 |
| 2015 | $4,531 | $9,577 | $1,890 | $7,687 |
| 2014 | $4,444 | $9,577 | $1,890 | $7,687 |
| 2013 | $4,069 | $9,481 | $1,890 | $7,591 |
Source: Public Records
Map
Nearby Homes
- 381 Yates Ave
- 372 Bensley Ave
- 353 Yates Ave
- 349 Yates Ave
- 452 Yates Ave
- 383 Calhoun Ave
- 428 Paxton Ave
- 330 Paxton Ave
- 286 Calhoun Ave
- 453 Hoxie Ave
- 383 Clyde Ave
- 405 Clyde Ave
- 275 Paxton Ave
- 288 Paxton Ave
- 427 Clyde Ave
- 351 Clyde Ave
- 451 Clyde Ave
- 1613 Astor St Unit 1W
- 1613 Astor St Unit 16131E
- 412 Saginaw Ave
- 389 Oglesby Ave
- 383 Oglesby Ave
- 379 Oglesby Ave
- 393 Oglesby Ave
- 395 Oglesby Ave Unit 2
- 395 Oglesby Ave
- 395 Oglesby Ave Unit 1
- 391 Oglesby Ave
- 375 Oglesby Ave
- 390 Yates Ave
- 384 Yates Ave
- 367 Oglesby Ave
- 399 Oglesby Ave
- 399 Oglesby Ave Unit 2
- 380 Yates Ave
- 394 Yates Ave
- 376 Yates Ave
- 386 Oglesby Ave
- 390 Oglesby Ave
- 396 Yates Ave