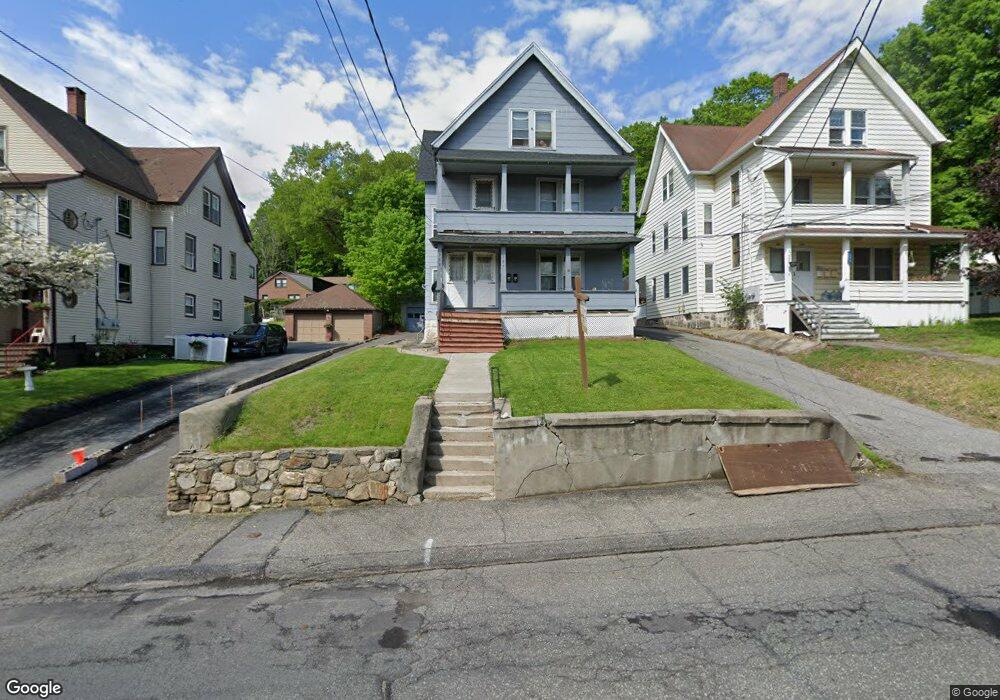
387 Riverside Ave Torrington, CT 06790
Estimated Value: $209,337 - $331,000
5
Beds
3
Baths
2,544
Sq Ft
$105/Sq Ft
Est. Value
About This Home
This home is located at 387 Riverside Ave, Torrington, CT 06790 and is currently estimated at $266,084, approximately $104 per square foot. 387 Riverside Ave is a home located in Litchfield County with nearby schools including Torrington Middle School, Torrington High School, and St. Peter School.
Ownership History
Date
Name
Owned For
Owner Type
Purchase Details
Closed on
Oct 27, 2022
Sold by
Shapiro Taylor
Bought by
Tcs Home Group Llc
Current Estimated Value
Purchase Details
Closed on
May 24, 2022
Sold by
Dodds J Brian
Bought by
Shapiro Taylor
Purchase Details
Closed on
Jul 18, 2005
Sold by
Marchell Henry Joseph
Bought by
Dodds J Brian
Purchase Details
Closed on
Mar 7, 2005
Sold by
Odonnell Craig W
Bought by
Marchell Henry Joseph
Create a Home Valuation Report for This Property
The Home Valuation Report is an in-depth analysis detailing your home's value as well as a comparison with similar homes in the area
Home Values in the Area
Average Home Value in this Area
Purchase History
| Date | Buyer | Sale Price | Title Company |
|---|---|---|---|
| Tcs Home Group Llc | -- | None Available | |
| Shapiro Taylor | $150,000 | None Available | |
| Dodds J Brian | $175,000 | -- | |
| Marchell Henry Joseph | $64,000 | -- |
Source: Public Records
Mortgage History
| Date | Status | Borrower | Loan Amount |
|---|---|---|---|
| Previous Owner | Marchell Henry Joseph | $161,382 | |
| Previous Owner | Marchell Henry Joseph | $192,188 | |
| Previous Owner | Marchell Henry Joseph | $189,348 |
Source: Public Records
Tax History Compared to Growth
Tax History
| Year | Tax Paid | Tax Assessment Tax Assessment Total Assessment is a certain percentage of the fair market value that is determined by local assessors to be the total taxable value of land and additions on the property. | Land | Improvement |
|---|---|---|---|---|
| 2025 | $7,886 | $205,100 | $20,370 | $184,730 |
| 2024 | $4,620 | $96,320 | $20,370 | $75,950 |
| 2023 | $4,620 | $96,320 | $20,370 | $75,950 |
| 2022 | $4,541 | $96,320 | $20,370 | $75,950 |
| 2021 | $4,447 | $96,320 | $20,370 | $75,950 |
| 2020 | $4,447 | $96,320 | $20,370 | $75,950 |
| 2019 | $3,886 | $84,170 | $20,370 | $63,800 |
| 2018 | $3,886 | $84,170 | $20,370 | $63,800 |
| 2017 | $3,851 | $84,170 | $20,370 | $63,800 |
| 2016 | $3,851 | $84,170 | $20,370 | $63,800 |
Source: Public Records
Map
Nearby Homes
- 213 Spring St
- 58 Eggleston St
- 91 Riverside Ave
- 69 McGuinness St
- 23 Berry St
- 0 Highland Ave Unit 24088105
- 118 Bannon St
- 27 Washington Ave
- 77 Chestnut Ave
- 8 Bancroft St
- 130 N Elm St
- 95 Colorado Ave N
- 68 Westledge Terrace
- 118 Pearl St
- 244 Hawthorne Terrace
- 30 Culvert St
- 121 Culvert St
- 7 Ford Ln
- 231 Beechwood Ave
- 482 Main St
- 387 Riverside Ave Unit U2
- 383 Riverside Ave
- 393 Riverside Ave
- 393 Riverside Ave Unit U3
- 393 Riverside Ave Unit U2
- 393 Riverside Ave Unit U1
- 279 Spring St
- 407 Riverside Ave
- 265 Spring St
- 421 Riverside Ave
- 370 Riverside Ave
- 400 Riverside Ave
- 355 Riverside Ave
- 358 Riverside Ave
- 364 Riverside Ave
- 418 Riverside Ave
- 255 Spring St
- 356 Riverside Ave
- 423 Riverside Ave
- 22 Dale St