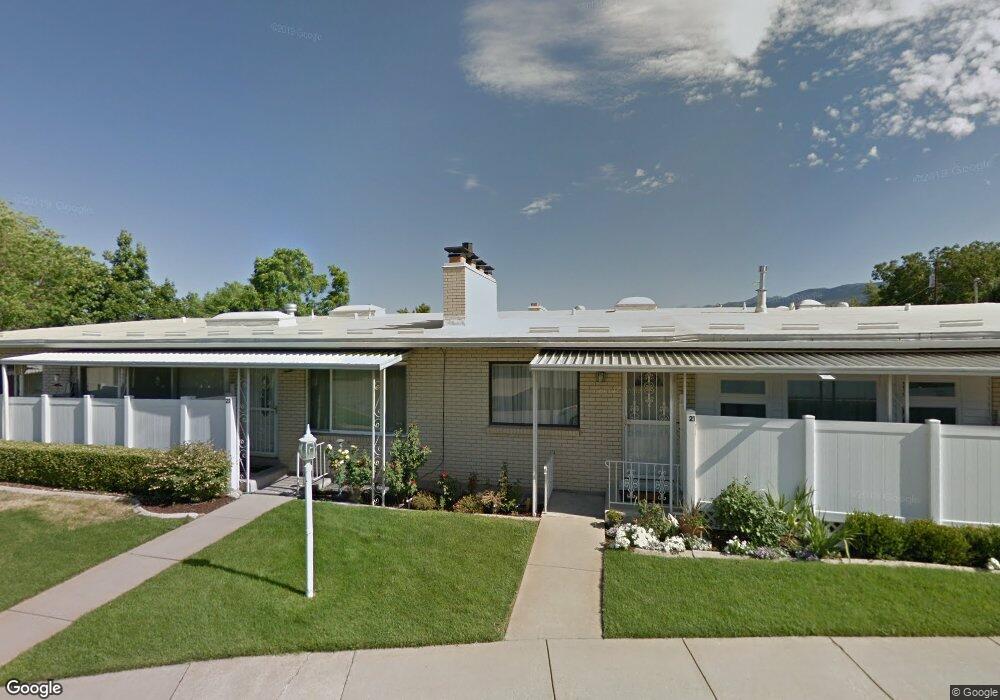
387 W 400 N Unit 21 Bountiful, UT 84010
Estimated Value: $339,000 - $366,000
3
Beds
3
Baths
2,618
Sq Ft
$134/Sq Ft
Est. Value
About This Home
This home is located at 387 W 400 N Unit 21, Bountiful, UT 84010 and is currently estimated at $350,333, approximately $133 per square foot. 387 W 400 N Unit 21 is a home located in Davis County with nearby schools including Meadowbrook Elementary School, Bountiful Junior High School, and Bountiful High School.
Ownership History
Date
Name
Owned For
Owner Type
Purchase Details
Closed on
Dec 4, 2021
Sold by
Gray Rodney A
Bought by
Gray Rodney A and Ostler Gray Susan
Current Estimated Value
Purchase Details
Closed on
Dec 7, 2016
Sold by
Summers Charlene
Bought by
Gray Rodney A
Purchase Details
Closed on
Mar 22, 2011
Sold by
Summers Dorrain M and Summers Charlene M
Bought by
Summers Dorrain M and Summers Charlene
Purchase Details
Closed on
Aug 12, 2003
Sold by
Morgan Thomas I
Bought by
Summers Dorrain M and Summers Charlene M
Home Financials for this Owner
Home Financials are based on the most recent Mortgage that was taken out on this home.
Original Mortgage
$105,930
Interest Rate
5.29%
Mortgage Type
Purchase Money Mortgage
Create a Home Valuation Report for This Property
The Home Valuation Report is an in-depth analysis detailing your home's value as well as a comparison with similar homes in the area
Purchase History
| Date | Buyer | Sale Price | Title Company |
|---|---|---|---|
| Gray Rodney A | -- | None Available | |
| Gray Rodney A | -- | Northwest Title | |
| Summers Dorrain M | -- | None Available | |
| Summers Dorrain M | -- | Bonneville Title Company Inc | |
| Morgan Thomas I | -- | Bonneville Title Company Inc |
Source: Public Records
Mortgage History
| Date | Status | Borrower | Loan Amount |
|---|---|---|---|
| Previous Owner | Summers Dorrain M | $105,930 |
Source: Public Records
Tax History
| Year | Tax Paid | Tax Assessment Tax Assessment Total Assessment is a certain percentage of the fair market value that is determined by local assessors to be the total taxable value of land and additions on the property. | Land | Improvement |
|---|---|---|---|---|
| 2025 | $1,877 | $176,550 | $48,950 | $127,600 |
| 2024 | $1,802 | $172,700 | $54,450 | $118,250 |
| 2023 | $1,775 | $309,000 | $93,000 | $216,000 |
| 2022 | $1,820 | $173,800 | $32,450 | $141,350 |
| 2021 | $1,823 | $267,000 | $46,000 | $221,000 |
| 2020 | $1,604 | $236,000 | $42,600 | $193,400 |
| 2019 | $1,494 | $214,000 | $39,000 | $175,000 |
| 2018 | $1,276 | $179,000 | $55,000 | $124,000 |
| 2016 | $1,094 | $83,050 | $13,750 | $69,300 |
| 2015 | $1,061 | $76,014 | $13,750 | $62,264 |
| 2014 | $1,056 | $77,853 | $18,333 | $59,520 |
| 2013 | -- | $70,796 | $17,600 | $53,196 |
Source: Public Records
Map
Nearby Homes
- 399 W 400 N Unit 47
- 401 W 400 N Unit 49
- 290 N 500 W Unit 108
- 290 N 500 W Unit 305
- 449 W 200 N Unit 3
- 332 N 300 W
- 75 N Peregrine Ln W Unit 8
- 320 N 200 W Unit 4
- 499 N 200 W Unit 30
- 563 N 200 W
- 106 W 700 N
- 252 N Main St
- 256 N Main St
- 254 N Main St
- 184 Park Shadows Cir
- 51 E 200 N Unit 3
- 55 E 200 N Unit 2
- 41 E 200 N Unit 6
- 366 W 1000 N
- 49 E 200 N Unit 4
- 387 W 400 N Unit 24
- 387 W 400 N Unit 23
- 387 W 400 N Unit 22
- 385 W 400 N Unit 20
- 385 W 400 N Unit 19
- 385 W 400 N
- 385 W 400 N Unit 17
- 385 W 400 N Unit 18
- 303 N 350 W
- 362 W 250 N
- 309 N 350 W
- 389 W 400 N Unit 28
- 389 W 400 N Unit 27
- 389 W 400 N Unit 26
- 389 W 400 N Unit 25
- 370 W 250 N
- 352 W 250 N
- 349 W 300 N
- 391 W 400 N Unit 32
- 391 W 400 N Unit 31
Your Personal Tour Guide
Ask me questions while you tour the home.