Estimated Value: $322,000 - $343,199
2
Beds
1
Bath
808
Sq Ft
$411/Sq Ft
Est. Value
About This Home
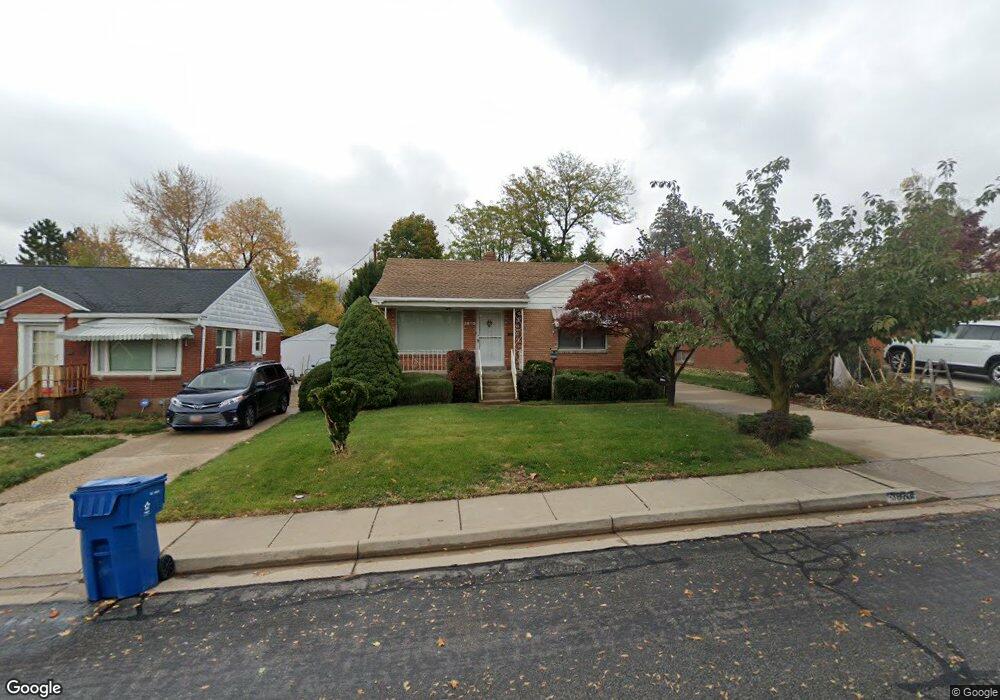
This home is located at 3870 Madison Ave, Ogden, UT 84403 and is currently estimated at $332,300, approximately $411 per square foot. 3870 Madison Ave is a home located in Weber County with nearby schools including Burch Creek School, South Ogden Junior High School, and Bonneville High School.
Ownership History
Date
Name
Owned For
Owner Type
Purchase Details
Closed on
Oct 13, 2009
Sold by
Littlefield Thomas W and Olson Vicki L
Bought by
Olson Audri A
Current Estimated Value
Home Financials for this Owner
Home Financials are based on the most recent Mortgage that was taken out on this home.
Original Mortgage
$108,109
Outstanding Balance
$70,377
Interest Rate
5.02%
Mortgage Type
FHA
Estimated Equity
$261,923
Purchase Details
Closed on
Jul 11, 2007
Sold by
Powers Patricia L and Olson Vicky L
Bought by
Littlefield Thomas W
Home Financials for this Owner
Home Financials are based on the most recent Mortgage that was taken out on this home.
Original Mortgage
$204,000
Outstanding Balance
$124,071
Interest Rate
5.99%
Mortgage Type
Reverse Mortgage Home Equity Conversion Mortgage
Estimated Equity
$208,229
Purchase Details
Closed on
Mar 28, 2007
Sold by
Littlefield Thomas W and Fowers Patricia L
Bought by
Fowers Patricia L and Olson Vicky L
Create a Home Valuation Report for This Property
The Home Valuation Report is an in-depth analysis detailing your home's value as well as a comparison with similar homes in the area
Home Values in the Area
Average Home Value in this Area
Purchase History
| Date | Buyer | Sale Price | Title Company |
|---|---|---|---|
| Olson Audri A | -- | Equity Title South Ogden | |
| Littlefield Thomas W | -- | Equity Title Ogden | |
| Fowers Patricia L | -- | None Available |
Source: Public Records
Mortgage History
| Date | Status | Borrower | Loan Amount |
|---|---|---|---|
| Open | Olson Audri A | $108,109 | |
| Open | Littlefield Thomas W | $204,000 |
Source: Public Records
Tax History Compared to Growth
Tax History
| Year | Tax Paid | Tax Assessment Tax Assessment Total Assessment is a certain percentage of the fair market value that is determined by local assessors to be the total taxable value of land and additions on the property. | Land | Improvement |
|---|---|---|---|---|
| 2025 | $2,466 | $335,804 | $105,003 | $230,801 |
| 2024 | $2,362 | $180,398 | $57,751 | $122,647 |
| 2023 | $2,234 | $171,049 | $57,708 | $113,341 |
| 2022 | $2,188 | $173,250 | $49,504 | $123,746 |
| 2021 | $1,882 | $248,000 | $54,011 | $193,989 |
| 2020 | $1,662 | $200,999 | $44,998 | $156,001 |
| 2019 | $1,558 | $178,000 | $35,019 | $142,981 |
| 2018 | $1,443 | $155,000 | $35,019 | $119,981 |
| 2017 | $1,281 | $129,000 | $30,007 | $98,993 |
| 2016 | $1,192 | $66,246 | $16,526 | $49,720 |
| 2015 | $1,208 | $66,246 | $16,526 | $49,720 |
| 2014 | $986 | $50,798 | $16,526 | $34,272 |
Source: Public Records
Map
Nearby Homes
- 3880 Raymond Ave
- 3874 Orchard Ave
- 3925 Nordin Ave
- 3853 Grandview Dr
- 3868 Grandview Dr
- 3813 Grandview Dr
- 575 40th St
- 516 Diana St
- 3864 S Quincy Ave Unit 119
- 3538 S Quincy Ave
- 4075 Jefferson Ave
- 4042 Porter Ave
- 4060 S 875 E Unit 54
- 865 Maple St
- 244 E 40th St S
- 896 E 40th St S
- 920 E 4050 S
- 552 41st St
- 855 36th St
- 4180 Liberty Ave
- 3876 Madison Ave
- 3850 Madison Ave
- 3880 Madison Ave
- 3895 Raymond Ave
- 3901 Raymond Ave
- 3846 Madison Ave
- 3884 Madison Ave
- 3846 Madison Ave
- 3875 Raymond Ave
- 3915 Raymond Ave
- 3865 Raymond Ave
- 3840 Madison Ave
- 3888 Madison Ave
- 3871 Madison Ave
- 3875 Madison Ave
- 3925 Raymond Ave
- 3855 Madison Ave
- 3855 Raymond Ave
- 3891 Madison Ave
- 3830 Madison Ave