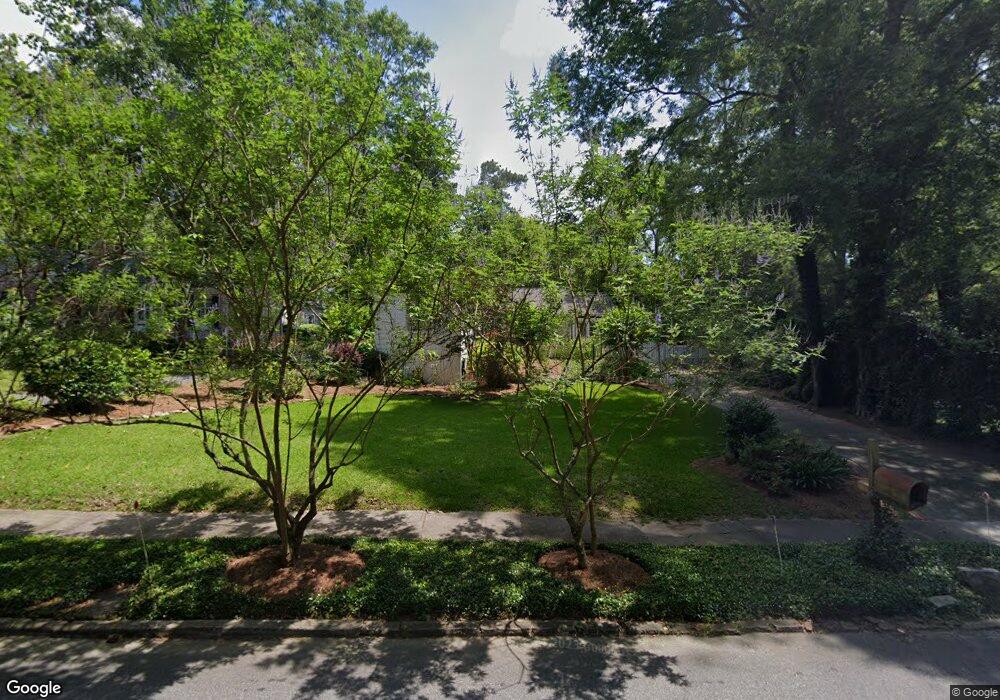
3870 Overlook Ave Macon, GA 31204
Ingleside Historic District NeighborhoodEstimated Value: $278,000 - $325,000
3
Beds
2
Baths
1,760
Sq Ft
$170/Sq Ft
Est. Value
About This Home
This home is located at 3870 Overlook Ave, Macon, GA 31204 and is currently estimated at $299,215, approximately $170 per square foot. 3870 Overlook Ave is a home located in Bibb County with nearby schools including Rosa Taylor Elementary School, Miller Fine Arts Magnet Middle School, and Central High School.
Ownership History
Date
Name
Owned For
Owner Type
Purchase Details
Closed on
Jun 11, 2010
Sold by
Fountain Kimberly D and Bills Jonathan D
Bought by
Barfield Vanessa M
Current Estimated Value
Home Financials for this Owner
Home Financials are based on the most recent Mortgage that was taken out on this home.
Original Mortgage
$176,621
Outstanding Balance
$118,333
Interest Rate
5.12%
Mortgage Type
FHA
Estimated Equity
$180,882
Purchase Details
Closed on
Mar 10, 2005
Sold by
Walker Ashley P and Walker Dana G
Bought by
Fountain Kimberly D and Bills Jonathan D
Home Financials for this Owner
Home Financials are based on the most recent Mortgage that was taken out on this home.
Original Mortgage
$140,000
Interest Rate
5.37%
Mortgage Type
Adjustable Rate Mortgage/ARM
Purchase Details
Closed on
Nov 23, 2004
Purchase Details
Closed on
Nov 29, 2000
Purchase Details
Closed on
Jan 24, 1997
Create a Home Valuation Report for This Property
The Home Valuation Report is an in-depth analysis detailing your home's value as well as a comparison with similar homes in the area
Home Values in the Area
Average Home Value in this Area
Purchase History
| Date | Buyer | Sale Price | Title Company |
|---|---|---|---|
| Barfield Vanessa M | $179,000 | None Available | |
| Fountain Kimberly D | $175,000 | None Available | |
| -- | -- | -- | |
| -- | $175,000 | -- | |
| -- | $131,500 | -- |
Source: Public Records
Mortgage History
| Date | Status | Borrower | Loan Amount |
|---|---|---|---|
| Open | Barfield Vanessa M | $176,621 | |
| Previous Owner | Fountain Kimberly D | $140,000 |
Source: Public Records
Tax History Compared to Growth
Tax History
| Year | Tax Paid | Tax Assessment Tax Assessment Total Assessment is a certain percentage of the fair market value that is determined by local assessors to be the total taxable value of land and additions on the property. | Land | Improvement |
|---|---|---|---|---|
| 2025 | $1,998 | $88,302 | $32,000 | $56,302 |
| 2024 | $2,065 | $88,302 | $32,000 | $56,302 |
| 2023 | $1,465 | $82,689 | $32,000 | $50,689 |
| 2022 | $1,980 | $64,182 | $14,883 | $49,299 |
| 2021 | $2,051 | $60,979 | $14,883 | $46,096 |
| 2020 | $1,857 | $54,839 | $14,883 | $39,956 |
| 2019 | $1,873 | $54,839 | $14,883 | $39,956 |
| 2018 | $3,048 | $54,839 | $14,883 | $39,956 |
| 2017 | $1,742 | $53,505 | $14,883 | $38,622 |
| 2016 | $1,609 | $53,505 | $14,883 | $38,622 |
| 2015 | $2,278 | $53,505 | $14,883 | $38,622 |
| 2014 | $2,646 | $53,066 | $14,883 | $38,182 |
Source: Public Records
Map
Nearby Homes
- 227 Forest Hill Rd
- 209 Forest Hill Rd
- 3823 Overlook Ave
- 3790 Overlook Ave
- 162 Parkwood Ave
- 3687 Overlook Dr
- 3687 Overlook Ave
- 3848 Berkley Dr
- 3698 Berkley Dr
- 518 High Point North Rd
- 4433 Azalea Dr
- 613 Rosa Taylor Dr
- 4403 Azalea Dr
- 603 Willow Creek Dr
- 4373 Barrington Place
- 620 Rosa Taylor Dr
- 648 Willow Creek Dr
- 3940 Grand Ave
- 3882 Overlook Ave
- 3879 the Prado
- 3885 the Prado
- 3875 Overlook Ave
- 3861 the Prado
- 3855 Overlook Ave
- 3891 the Prado
- 3857 the Prado
- 3897 the Prado
- 3890 Overlook Ave
- 3847 Overlook Ave
- 3824 Overlook Ave Unit 107FF20
- 3824 Overlook Ave
- 0 the Prado
- 3849 the Prado
- 3872 the Prado
- 3878 the Prado
- 3868 the Prado
- 3835 Overlook Ave
- 3888 the Prado