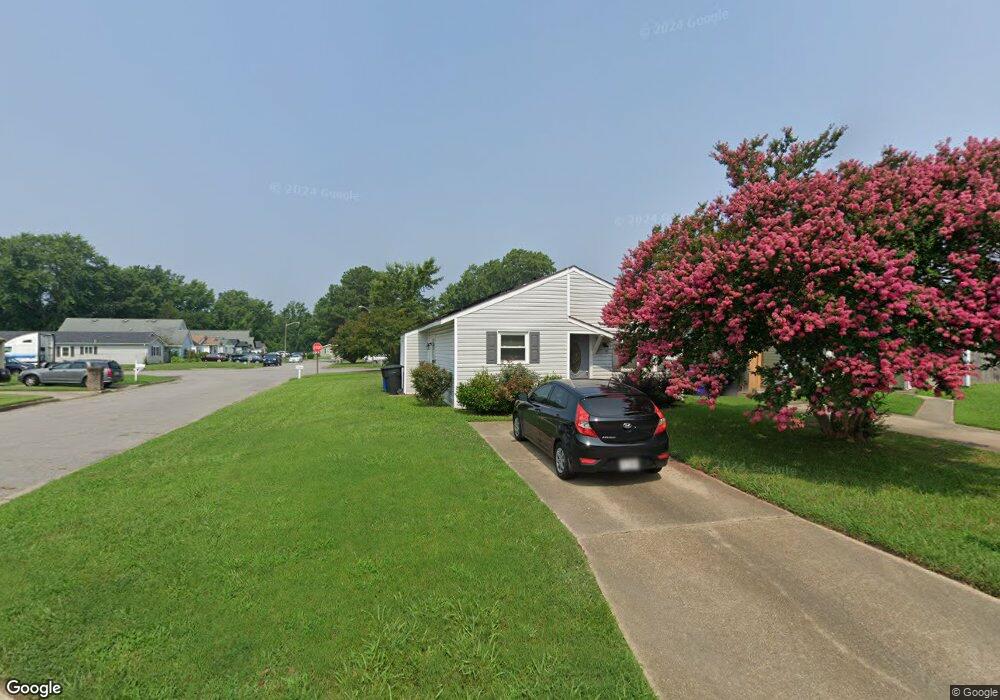
3872 Augustine Cir Portsmouth, VA 23703
Churchland NeighborhoodEstimated Value: $205,000 - $218,000
3
Beds
2
Baths
1,022
Sq Ft
$206/Sq Ft
Est. Value
About This Home
This home is located at 3872 Augustine Cir, Portsmouth, VA 23703 and is currently estimated at $210,641, approximately $206 per square foot. 3872 Augustine Cir is a home located in Portsmouth City with nearby schools including Churchland Primary/Intermediate School, Churchland Middle School, and Churchland High School.
Ownership History
Date
Name
Owned For
Owner Type
Purchase Details
Closed on
Aug 24, 2015
Sold by
Young Christopher Lynn
Bought by
Thomas Kevin D and Thomas Tawanda
Current Estimated Value
Home Financials for this Owner
Home Financials are based on the most recent Mortgage that was taken out on this home.
Original Mortgage
$114,880
Outstanding Balance
$90,780
Interest Rate
4.25%
Mortgage Type
FHA
Estimated Equity
$119,861
Purchase Details
Closed on
Mar 5, 2015
Sold by
The Secretary Of Hud Of Washin
Bought by
Young Christopher L
Purchase Details
Closed on
Jun 25, 2014
Sold by
Atlantic Trustee Svcs Llc Sub and Williams Flora
Bought by
The Secretary Of Hud
Purchase Details
Closed on
Jul 26, 2006
Sold by
Brown Quinan T
Bought by
Williams Flora
Home Financials for this Owner
Home Financials are based on the most recent Mortgage that was taken out on this home.
Original Mortgage
$8,000
Interest Rate
6.8%
Mortgage Type
Purchase Money Mortgage
Create a Home Valuation Report for This Property
The Home Valuation Report is an in-depth analysis detailing your home's value as well as a comparison with similar homes in the area
Home Values in the Area
Average Home Value in this Area
Purchase History
| Date | Buyer | Sale Price | Title Company |
|---|---|---|---|
| Thomas Kevin D | $117,000 | None Available | |
| Young Christopher L | $55,000 | -- | |
| The Secretary Of Hud | $144,723 | -- | |
| Williams Flora | $137,500 | -- |
Source: Public Records
Mortgage History
| Date | Status | Borrower | Loan Amount |
|---|---|---|---|
| Open | Thomas Kevin D | $114,880 | |
| Previous Owner | Williams Flora | $8,000 | |
| Previous Owner | Williams Flora | $116,875 |
Source: Public Records
Tax History Compared to Growth
Tax History
| Year | Tax Paid | Tax Assessment Tax Assessment Total Assessment is a certain percentage of the fair market value that is determined by local assessors to be the total taxable value of land and additions on the property. | Land | Improvement |
|---|---|---|---|---|
| 2025 | $2,374 | $182,600 | $52,390 | $130,210 |
| 2024 | $2,374 | $179,110 | $52,390 | $126,720 |
| 2023 | $2,020 | $161,630 | $52,390 | $109,240 |
| 2022 | $1,885 | $145,030 | $41,910 | $103,120 |
| 2021 | $1,704 | $131,060 | $34,930 | $96,130 |
| 2020 | $1,559 | $125,020 | $33,260 | $91,760 |
| 2019 | $1,504 | $115,680 | $31,270 | $84,410 |
| 2018 | $1,460 | $112,310 | $31,270 | $81,040 |
| 2017 | $1,438 | $110,620 | $31,270 | $79,350 |
| 2016 | $1,416 | $108,930 | $31,270 | $77,660 |
| 2015 | $1,313 | $100,990 | $31,270 | $69,720 |
| 2014 | $1,283 | $100,990 | $31,270 | $69,720 |
Source: Public Records
Map
Nearby Homes
- 3860 Sugar Creek Cir
- 3866 Augustine Cir
- 3818 Peach Orchard Cir
- 3877 Peachtree Ln W
- 3817 Harvest Ct
- 3660B Towne Point Rd Unit A
- 3913 Stateflower Ct
- 3791 Towne Point Rd
- 4100 Mayfair Way
- 3433 Willow Breeze Dr
- 17 Shoal Ct
- 5807 Dunkin St
- 3616 Bowden St
- 3715 Magnolia Dr
- 6015 Arthur Ave
- 8 Compass Ct
- 3604 Pierce St
- 3705 Bamboo Rd
- 3836 Old Farm Rd
- 4071 Long Point Blvd
- 3874 Augustine Cir
- 3870 Augustine Cir
- 3863 Peachtree Ln E
- 3876 Augustine Cir
- 3875 Augustine Cir
- 3873 Augustine Cir
- 3865 Peachtree Ln E
- 3877 Augustine Cir
- 3871 Augustine Cir
- 3878 Augustine Cir
- 3879 Augustine Cir
- 3880 Augustine Cir
- 3867 Peachtree Ln E
- 3801 Augustine Cir
- 3881 Augustine Cir
- 3882 Augustine Cir
- 3883 Augustine Cir
- 3871 Peachtree Ln E
- 3803 Augustine Cir
- 3800 Augustine Cir