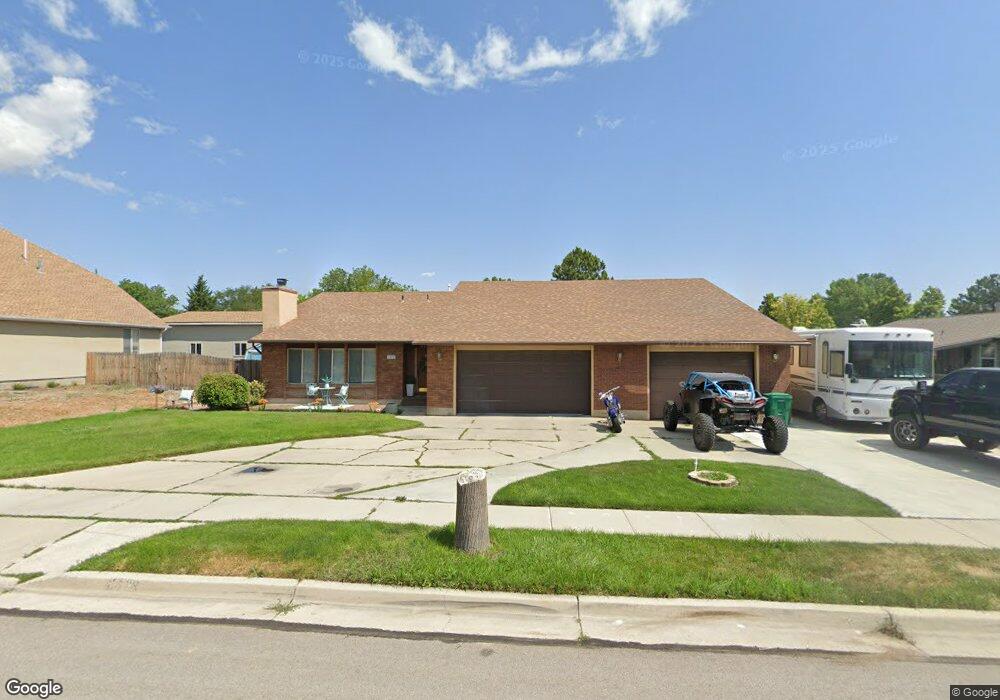
3872 W 7965 S West Jordan, UT 84088
Jordan Oaks NeighborhoodEstimated Value: $568,000 - $634,000
4
Beds
2
Baths
3,192
Sq Ft
$186/Sq Ft
Est. Value
About This Home
This home is located at 3872 W 7965 S, West Jordan, UT 84088 and is currently estimated at $592,742, approximately $185 per square foot. 3872 W 7965 S is a home located in Salt Lake County with nearby schools including Columbia Elementary School, Joel P. Jensen Middle School, and West Jordan High School.
Ownership History
Date
Name
Owned For
Owner Type
Purchase Details
Closed on
Aug 23, 2022
Sold by
Sfr Acquisitions 2 Llc
Bought by
Kuntz Kyle
Current Estimated Value
Home Financials for this Owner
Home Financials are based on the most recent Mortgage that was taken out on this home.
Original Mortgage
$580,925
Outstanding Balance
$554,454
Interest Rate
5.3%
Mortgage Type
New Conventional
Estimated Equity
$38,288
Purchase Details
Closed on
Feb 28, 2022
Sold by
Jensen Jeffrey M
Bought by
Sfr Acquisitions 2 Llc
Purchase Details
Closed on
Jun 30, 2009
Sold by
Jensen Jeffrey M
Bought by
Jensen Jeffrey M and Jensen Julianne
Home Financials for this Owner
Home Financials are based on the most recent Mortgage that was taken out on this home.
Original Mortgage
$29,000
Interest Rate
4.43%
Mortgage Type
Credit Line Revolving
Create a Home Valuation Report for This Property
The Home Valuation Report is an in-depth analysis detailing your home's value as well as a comparison with similar homes in the area
Home Values in the Area
Average Home Value in this Area
Purchase History
| Date | Buyer | Sale Price | Title Company |
|---|---|---|---|
| Kuntz Kyle | -- | Metro National Title | |
| Sfr Acquisitions 2 Llc | -- | Metro National Title | |
| Sfr Acquisitions 2 Llc | -- | Metro National Title | |
| Jensen Jeffrey M | -- | Accommodation |
Source: Public Records
Mortgage History
| Date | Status | Borrower | Loan Amount |
|---|---|---|---|
| Open | Kuntz Kyle | $580,925 | |
| Previous Owner | Jensen Jeffrey M | $29,000 |
Source: Public Records
Tax History Compared to Growth
Tax History
| Year | Tax Paid | Tax Assessment Tax Assessment Total Assessment is a certain percentage of the fair market value that is determined by local assessors to be the total taxable value of land and additions on the property. | Land | Improvement |
|---|---|---|---|---|
| 2025 | $2,952 | $583,800 | $127,500 | $456,300 |
| 2024 | $2,952 | $568,000 | $123,200 | $444,800 |
| 2023 | $5,274 | $526,000 | $118,500 | $407,500 |
| 2022 | $5,075 | $497,900 | $116,200 | $381,700 |
| 2021 | $4,295 | $383,600 | $91,900 | $291,700 |
| 2020 | $2,176 | $331,700 | $85,900 | $245,800 |
| 2019 | $2,191 | $327,400 | $85,900 | $241,500 |
| 2018 | $2,025 | $300,100 | $81,100 | $219,000 |
| 2017 | $1,891 | $279,100 | $81,100 | $198,000 |
| 2016 | $1,780 | $246,800 | $81,100 | $165,700 |
| 2015 | $1,784 | $241,200 | $82,700 | $158,500 |
| 2014 | $1,704 | $226,800 | $78,800 | $148,000 |
Source: Public Records
Map
Nearby Homes
- 7989 S 3725 W
- 7991 S 3725 W
- 3647 W 7865 S
- 3977 W Elwood Way
- 3629 W 7825 S
- 3546 W 7980 S
- 3476 W Spaulding Rd
- 8180 S Old Bingham Hwy
- 8058 S Lismore Ln Unit 304
- 3422 Briar Dr
- 8400 S 4000 W Unit 134
- 3332 Lower Newark Way
- 8461 S Meadowlark Ln
- 3354 W 7800 S
- 7611 S Springbrook Dr
- 7973 S Nebo Dr
- 3888 W 8700 S
- 3165 W 7720 S
- 3066 W Linton Dr
- 4678 Emmons Dr