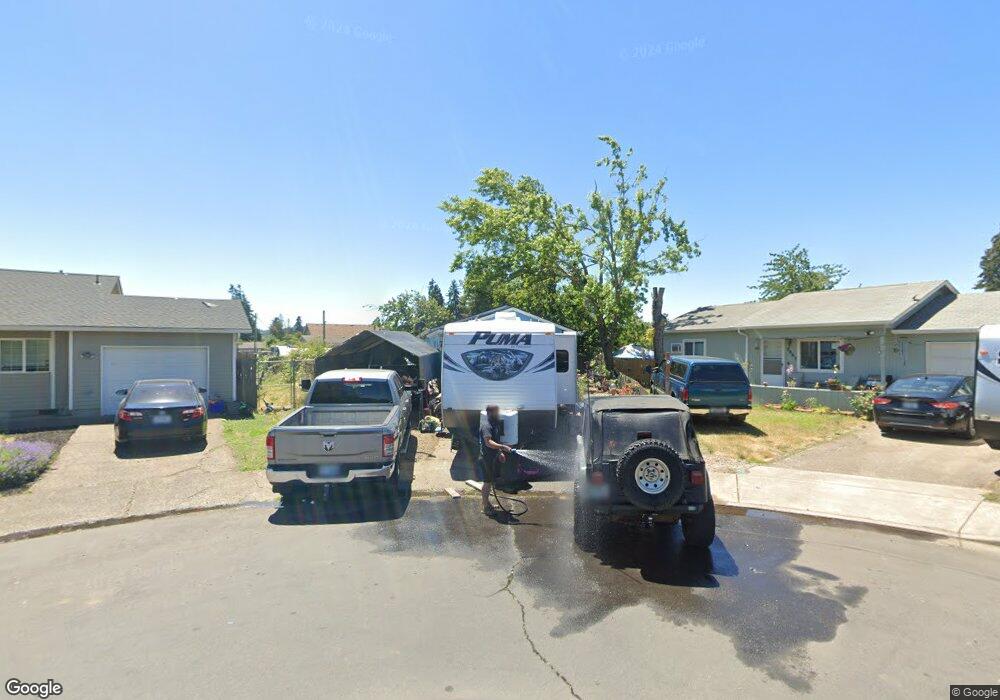
3875 Aster St Springfield, OR 97478
East Springfield NeighborhoodEstimated Value: $320,000 - $351,000
3
Beds
1
Bath
1,042
Sq Ft
$320/Sq Ft
Est. Value
About This Home
This home is located at 3875 Aster St, Springfield, OR 97478 and is currently estimated at $333,669, approximately $320 per square foot. 3875 Aster St is a home located in Lane County with nearby schools including Douglas Gardens Elementary School, Agnes Stewart Middle School, and Springfield High School.
Ownership History
Date
Name
Owned For
Owner Type
Purchase Details
Closed on
Nov 9, 2005
Sold by
Kelson Michael D
Bought by
Clark Daniel K and Clark Teresa L
Current Estimated Value
Home Financials for this Owner
Home Financials are based on the most recent Mortgage that was taken out on this home.
Original Mortgage
$101,250
Outstanding Balance
$57,192
Interest Rate
6.75%
Mortgage Type
Fannie Mae Freddie Mac
Estimated Equity
$276,477
Purchase Details
Closed on
Aug 9, 2000
Sold by
Kelson Lori D and Francoso Lori D
Bought by
Kelson Michael D
Create a Home Valuation Report for This Property
The Home Valuation Report is an in-depth analysis detailing your home's value as well as a comparison with similar homes in the area
Home Values in the Area
Average Home Value in this Area
Purchase History
| Date | Buyer | Sale Price | Title Company |
|---|---|---|---|
| Clark Daniel K | $135,000 | Fidelity National Title Insu | |
| Kelson Michael D | $18,200 | Fidelity National Title Co |
Source: Public Records
Mortgage History
| Date | Status | Borrower | Loan Amount |
|---|---|---|---|
| Open | Clark Daniel K | $101,250 |
Source: Public Records
Tax History
| Year | Tax Paid | Tax Assessment Tax Assessment Total Assessment is a certain percentage of the fair market value that is determined by local assessors to be the total taxable value of land and additions on the property. | Land | Improvement |
|---|---|---|---|---|
| 2025 | $2,700 | $147,228 | -- | -- |
| 2024 | $2,656 | $142,940 | -- | -- |
| 2023 | $2,656 | $138,777 | $0 | $0 |
| 2022 | $2,460 | $134,735 | $0 | $0 |
| 2021 | $2,416 | $130,811 | $0 | $0 |
| 2020 | $2,345 | $127,001 | $0 | $0 |
| 2019 | $2,275 | $123,302 | $0 | $0 |
| 2018 | $2,144 | $116,224 | $0 | $0 |
| 2017 | $2,062 | $116,224 | $0 | $0 |
| 2016 | $2,019 | $112,839 | $0 | $0 |
| 2015 | $1,961 | $109,552 | $0 | $0 |
| 2014 | $1,931 | $106,361 | $0 | $0 |
Source: Public Records
Map
Nearby Homes
Your Personal Tour Guide
Ask me questions while you tour the home.