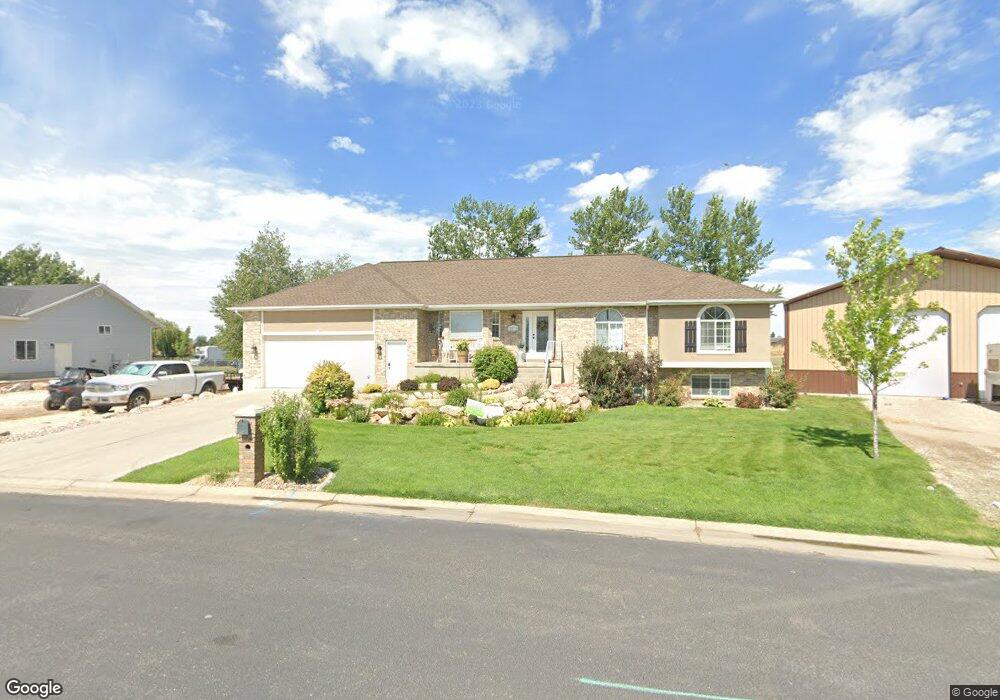
3875 Country Cove Way West Haven, UT 84401
Estimated Value: $658,000 - $763,967
5
Beds
3
Baths
2,938
Sq Ft
$237/Sq Ft
Est. Value
About This Home
This home is located at 3875 Country Cove Way, West Haven, UT 84401 and is currently estimated at $695,992, approximately $236 per square foot. 3875 Country Cove Way is a home located in Weber County with nearby schools including Country View School, Rocky Mountain Junior High School, and Fremont High School.
Ownership History
Date
Name
Owned For
Owner Type
Purchase Details
Closed on
Sep 9, 2020
Sold by
Gale Cory D and Gale Ashley D
Bought by
Gale Corey and Gale Ashley
Current Estimated Value
Home Financials for this Owner
Home Financials are based on the most recent Mortgage that was taken out on this home.
Original Mortgage
$318,000
Outstanding Balance
$271,377
Interest Rate
2.9%
Mortgage Type
New Conventional
Estimated Equity
$424,615
Purchase Details
Closed on
Feb 21, 2013
Sold by
Flyway 3 Llc
Bought by
Gale Corey D and Gale Ashley D
Home Financials for this Owner
Home Financials are based on the most recent Mortgage that was taken out on this home.
Original Mortgage
$245,471
Interest Rate
3.37%
Mortgage Type
FHA
Purchase Details
Closed on
Jul 18, 2012
Sold by
Heitz Kent Matthew
Bought by
Flyway 3 Llc
Home Financials for this Owner
Home Financials are based on the most recent Mortgage that was taken out on this home.
Original Mortgage
$230,100
Interest Rate
3.63%
Mortgage Type
New Conventional
Purchase Details
Closed on
Feb 20, 2009
Sold by
Heitz Kent M
Bought by
Flyway 3 Llc
Purchase Details
Closed on
Jul 1, 2008
Sold by
Hebert Laura
Bought by
Heitz Kent Matthew
Home Financials for this Owner
Home Financials are based on the most recent Mortgage that was taken out on this home.
Original Mortgage
$236,800
Interest Rate
6%
Mortgage Type
Purchase Money Mortgage
Purchase Details
Closed on
May 19, 2008
Sold by
Black Aaron and Black Rebecca
Bought by
Hebert Laura
Home Financials for this Owner
Home Financials are based on the most recent Mortgage that was taken out on this home.
Original Mortgage
$236,800
Interest Rate
6%
Mortgage Type
Purchase Money Mortgage
Purchase Details
Closed on
Sep 19, 2005
Sold by
Black Aaron
Bought by
Black Aaron and Black Rebecca
Home Financials for this Owner
Home Financials are based on the most recent Mortgage that was taken out on this home.
Original Mortgage
$243,000
Interest Rate
7.37%
Mortgage Type
New Conventional
Purchase Details
Closed on
Dec 18, 2000
Sold by
Vankomen Robert H
Bought by
Black Aaron L and Black Rebecca
Home Financials for this Owner
Home Financials are based on the most recent Mortgage that was taken out on this home.
Original Mortgage
$159,300
Interest Rate
7.67%
Create a Home Valuation Report for This Property
The Home Valuation Report is an in-depth analysis detailing your home's value as well as a comparison with similar homes in the area
Home Values in the Area
Average Home Value in this Area
Purchase History
| Date | Buyer | Sale Price | Title Company |
|---|---|---|---|
| Gale Corey | -- | Advanced Title | |
| Gale Corey D | -- | American Preferred Title | |
| Flyway 3 Llc | -- | American Preferred Title | |
| Heitz Kent Matthew | -- | American Preferred Title | |
| Flyway 3 Llc | -- | None Available | |
| Heitz Kent Matthew | -- | Simple Title & Escrow Llc | |
| Hebert Laura | -- | Simple Title & Escrow Llc | |
| Black Aaron | -- | Backman | |
| Black Aaron | -- | Backman | |
| Black Aaron L | -- | Bonneville Title Company |
Source: Public Records
Mortgage History
| Date | Status | Borrower | Loan Amount |
|---|---|---|---|
| Open | Gale Corey | $318,000 | |
| Closed | Gale Corey D | $245,471 | |
| Previous Owner | Heitz Kent Matthew | $230,100 | |
| Previous Owner | Heitz Kent Matthew | $236,800 | |
| Previous Owner | Hebert Laura | $249,700 | |
| Previous Owner | Black Aaron | $243,000 | |
| Previous Owner | Black Aaron L | $159,300 |
Source: Public Records
Tax History Compared to Growth
Tax History
| Year | Tax Paid | Tax Assessment Tax Assessment Total Assessment is a certain percentage of the fair market value that is determined by local assessors to be the total taxable value of land and additions on the property. | Land | Improvement |
|---|---|---|---|---|
| 2025 | $4,598 | $370,827 | $96,877 | $273,950 |
| 2024 | $4,364 | $364,056 | $96,877 | $267,179 |
| 2023 | $4,187 | $351,972 | $97,118 | $254,854 |
| 2022 | $4,347 | $377,957 | $97,118 | $280,839 |
| 2021 | $3,427 | $483,001 | $91,125 | $391,876 |
| 2020 | $3,212 | $421,999 | $75,881 | $346,118 |
| 2019 | $3,116 | $392,002 | $72,226 | $319,776 |
| 2018 | $3,069 | $373,000 | $72,226 | $300,774 |
| 2017 | $2,676 | $312,000 | $73,572 | $238,428 |
| 2016 | $2,569 | $166,139 | $29,586 | $136,553 |
| 2015 | $2,241 | $142,384 | $26,854 | $115,530 |
| 2014 | $2,197 | $136,405 | $35,063 | $101,342 |
Source: Public Records
Map
Nearby Homes
- 3238 S 4950 W
- 3243 S 4950 W Unit 25
- 3263 S 4950 W Unit 24
- 3225 S 4950 W Unit 26
- 3198 S 4950 W Unit 29
- 3192 S 4950 W Unit 28
- 3233 S 4975 W Unit 14
- 3223 S 4975 W Unit 15
- 3257 S 4975 W Unit 12
- 3269 S 4975 W Unit 11
- 3731 S 4975 W
- 4712 W 4100 S
- 3660 S 4700 W
- 4126 S 4950 W
- 4622 W 3725 S Unit 231
- 4941 W 3575 S
- 4618 W 3725 S Unit 233
- 4589 W 3725 S Unit 248
- 3690 S 4625 W Unit 228
- 4521 W 3950 S Unit 5
- 3885 Country Cove Way
- 4810 Country Cove Way
- 4795 Country Cove Way
- 3915 Country Cove Way
- 3880 Country Cove Way
- 4780 Country Cove Way
- 3910 Country Cove Way
- 4755 Country Cove Way
- 4750 Country Cove Way
- 3866 S 4950 W
- 3875 S 4950 W
- 3875 S 4950 W Unit 62
- 3848 S 4950 W
- 4735 Country Cove Way
- 4730 Country Cove Way
- 3830 S 4950 W
- 4710 Country Cove Way
- 4937 W Haven Rd
- 4937 W Haven Rd Unit 67
- 4715 Country Cove Way