Estimated Value: $383,000 - $418,000
3
Beds
2
Baths
1,912
Sq Ft
$207/Sq Ft
Est. Value
About This Home
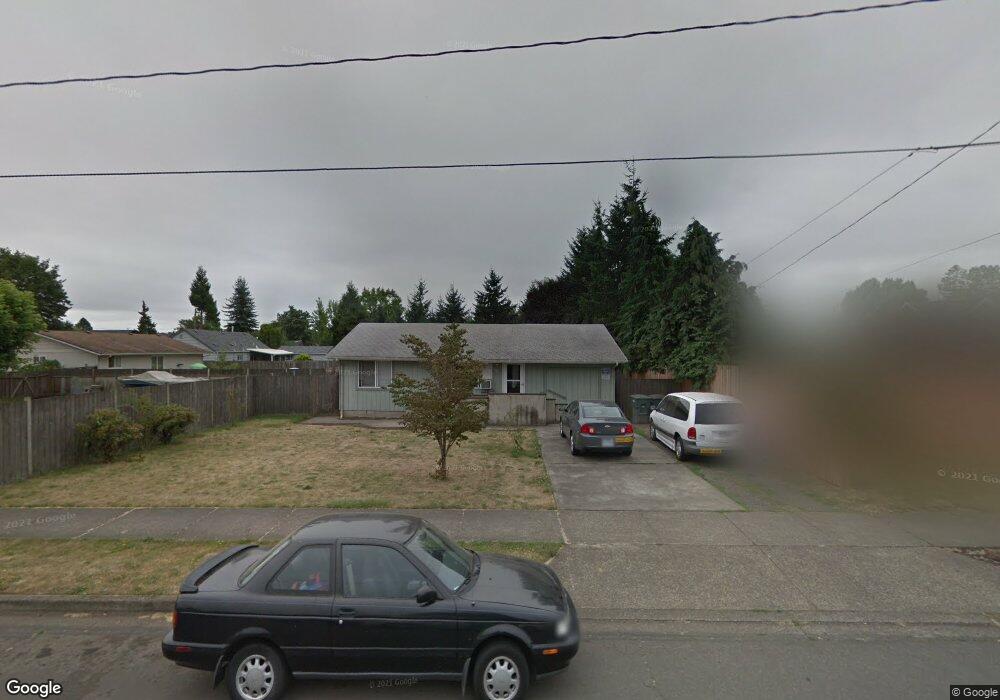
This home is located at 3875 E St, Springfield, OR 97478 and is currently estimated at $396,662, approximately $207 per square foot. 3875 E St is a home located in Lane County with nearby schools including Riverbend Elementary School, Briggs Middle School, and Thurston High School.
Ownership History
Date
Name
Owned For
Owner Type
Purchase Details
Closed on
Sep 3, 2009
Sold by
Alvord Taylor Inc
Bought by
Alvord Taylor Inc
Current Estimated Value
Home Financials for this Owner
Home Financials are based on the most recent Mortgage that was taken out on this home.
Original Mortgage
$86,600
Interest Rate
5.19%
Mortgage Type
New Conventional
Purchase Details
Closed on
Apr 10, 1998
Sold by
City Of Springfield
Bought by
Alvord Taylor Houses Inc
Home Financials for this Owner
Home Financials are based on the most recent Mortgage that was taken out on this home.
Original Mortgage
$125,000
Interest Rate
7.07%
Create a Home Valuation Report for This Property
The Home Valuation Report is an in-depth analysis detailing your home's value as well as a comparison with similar homes in the area
Home Values in the Area
Average Home Value in this Area
Purchase History
| Date | Buyer | Sale Price | Title Company |
|---|---|---|---|
| Alvord Taylor Inc | -- | Cascade Title Co | |
| Alvord Taylor Houses Inc | -- | -- | |
| City Of Springfield | -- | -- | |
| Alvord Taylor Houses Inc | $112,000 | Title Guaranty Company |
Source: Public Records
Mortgage History
| Date | Status | Borrower | Loan Amount |
|---|---|---|---|
| Closed | Alvord Taylor Inc | $86,600 | |
| Previous Owner | Alvord Taylor Houses Inc | $125,000 |
Source: Public Records
Tax History
| Year | Tax Paid | Tax Assessment Tax Assessment Total Assessment is a certain percentage of the fair market value that is determined by local assessors to be the total taxable value of land and additions on the property. | Land | Improvement |
|---|---|---|---|---|
| 2025 | -- | $167,115 | -- | -- |
| 2024 | -- | $162,248 | -- | -- |
| 2023 | -- | $157,523 | $0 | $0 |
| 2022 | $0 | $152,935 | $0 | $0 |
| 2021 | $0 | $148,481 | $0 | $0 |
| 2020 | $0 | $144,157 | $0 | $0 |
| 2019 | $0 | $139,959 | $0 | $0 |
| 2018 | $0 | $131,925 | $0 | $0 |
| 2017 | $0 | $131,925 | $0 | $0 |
| 2016 | -- | $128,083 | $0 | $0 |
| 2015 | -- | $124,352 | $0 | $0 |
| 2014 | -- | $120,730 | $0 | $0 |
Source: Public Records
Map
Nearby Homes
Your Personal Tour Guide
Ask me questions while you tour the home.