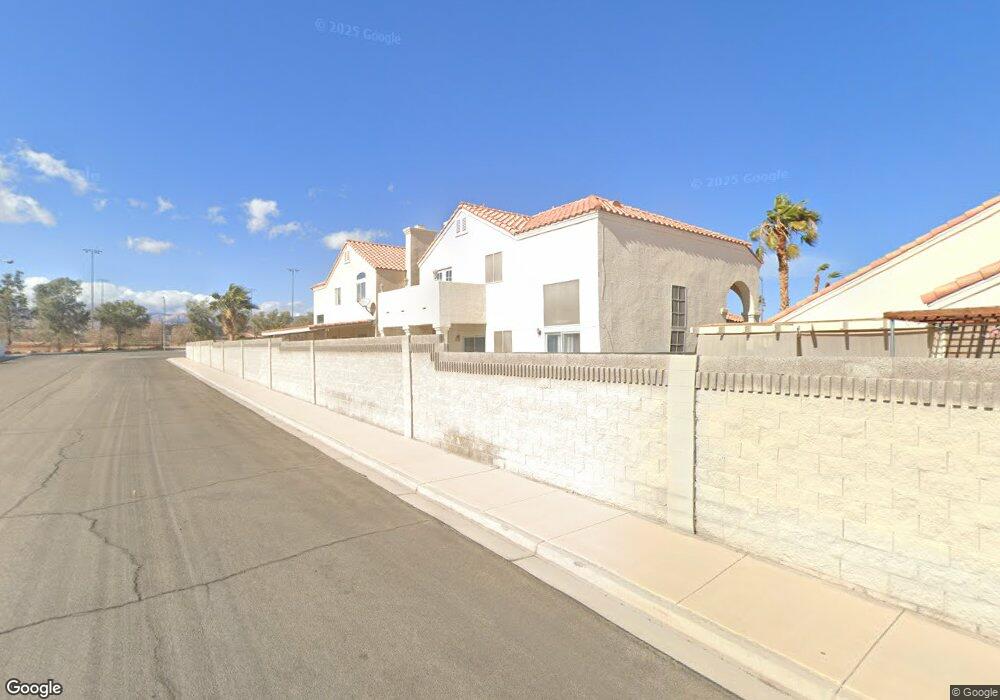
3877 Willowview Ct Unit II Las Vegas, NV 89147
Estimated Value: $497,000 - $543,529
4
Beds
3
Baths
2,217
Sq Ft
$236/Sq Ft
Est. Value
About This Home
This home is located at 3877 Willowview Ct Unit II, Las Vegas, NV 89147 and is currently estimated at $523,382, approximately $236 per square foot. 3877 Willowview Ct Unit II is a home located in Clark County with nearby schools including Pat Diskin Elementary School, Clifford J Lawrence Junior High School, and Spring Valley High School.
Ownership History
Date
Name
Owned For
Owner Type
Purchase Details
Closed on
Jul 24, 2001
Sold by
Wilson Michele G
Bought by
Johnson Gary and Johnson Candy
Current Estimated Value
Home Financials for this Owner
Home Financials are based on the most recent Mortgage that was taken out on this home.
Original Mortgage
$189,150
Outstanding Balance
$72,946
Interest Rate
7.15%
Estimated Equity
$450,436
Purchase Details
Closed on
Dec 18, 1995
Sold by
Greenpark Construction Company
Bought by
Wilson Michele G
Home Financials for this Owner
Home Financials are based on the most recent Mortgage that was taken out on this home.
Original Mortgage
$129,150
Interest Rate
9.62%
Purchase Details
Closed on
Dec 15, 1995
Sold by
Wilson Gary M and Wilson Michele G
Bought by
Wilson Michele G
Home Financials for this Owner
Home Financials are based on the most recent Mortgage that was taken out on this home.
Original Mortgage
$129,150
Interest Rate
9.62%
Create a Home Valuation Report for This Property
The Home Valuation Report is an in-depth analysis detailing your home's value as well as a comparison with similar homes in the area
Home Values in the Area
Average Home Value in this Area
Purchase History
| Date | Buyer | Sale Price | Title Company |
|---|---|---|---|
| Johnson Gary | $195,000 | National Title Company | |
| Wilson Michele G | $152,000 | Land Title | |
| Wilson Michele G | -- | Land Title |
Source: Public Records
Mortgage History
| Date | Status | Borrower | Loan Amount |
|---|---|---|---|
| Open | Johnson Gary | $189,150 | |
| Previous Owner | Wilson Michele G | $129,150 |
Source: Public Records
Tax History Compared to Growth
Tax History
| Year | Tax Paid | Tax Assessment Tax Assessment Total Assessment is a certain percentage of the fair market value that is determined by local assessors to be the total taxable value of land and additions on the property. | Land | Improvement |
|---|---|---|---|---|
| 2025 | $2,299 | $119,659 | $33,250 | $86,409 |
| 2024 | $2,231 | $119,659 | $33,250 | $86,409 |
| 2023 | $2,231 | $116,807 | $35,000 | $81,807 |
| 2022 | $2,368 | $102,933 | $27,650 | $75,283 |
| 2021 | $2,372 | $96,082 | $24,500 | $71,582 |
| 2020 | $2,034 | $95,694 | $24,500 | $71,194 |
| 2019 | $1,975 | $90,207 | $19,950 | $70,257 |
| 2018 | $1,918 | $85,106 | $17,500 | $67,606 |
| 2017 | $1,816 | $86,296 | $17,500 | $68,796 |
| 2016 | $1,816 | $79,398 | $12,600 | $66,798 |
| 2015 | $1,812 | $75,670 | $10,850 | $64,820 |
| 2014 | $1,760 | $58,206 | $9,100 | $49,106 |
Source: Public Records
Map
Nearby Homes
- 3869 Spruceview Ct
- 7570 W Flamingo Rd Unit 219
- 7570 W Flamingo Rd Unit 125
- 3974 Round Wood St
- 7400 W Flamingo Rd Unit 1071
- 7400 W Flamingo Rd Unit 2094
- 7400 W Flamingo Rd Unit 2033
- 7400 W Flamingo Rd Unit 1033
- 7400 W Flamingo Rd Unit 2013
- 4121 Satinwood Dr
- 4144 Moorcroft St
- 3685 Springbud Dr
- 7231 Sequoia Springs Dr
- 7150 Mountain Moss Dr
- 7938 Angel Tree Ct
- 7072 Parasol Ln
- 7885 W Flamingo Rd Unit 1061
- 7885 W Flamingo Rd Unit 1113
- 7885 W Flamingo Rd Unit 1115
- 7885 W Flamingo Rd Unit 1016
- 3869 Willowview Ct
- 7557 Tamarind Ave Unit 11
- 7547 Tamarind Ave
- 3861 Willowview Ct
- 3870 Willowview Ct
- 7537 Tamarind Ave
- 3853 Willowview Ct Unit II
- 3862 Willowview Ct Unit II
- 7527 Tamarind Ave Unit II
- 3845 Willowview Ct
- 3854 Willowview Ct
- 7530 Sea Mist Ln
- 3907 Mountain Birch St
- 7520 Sea Mist Ln
- 3846 Willowview Ct
- 7517 Tamarind Ave
- 3837 Willowview Ct
- 3869 Spruceview Ct
- 7510 Sea Mist Ln
- 3861 Spruceview Ct