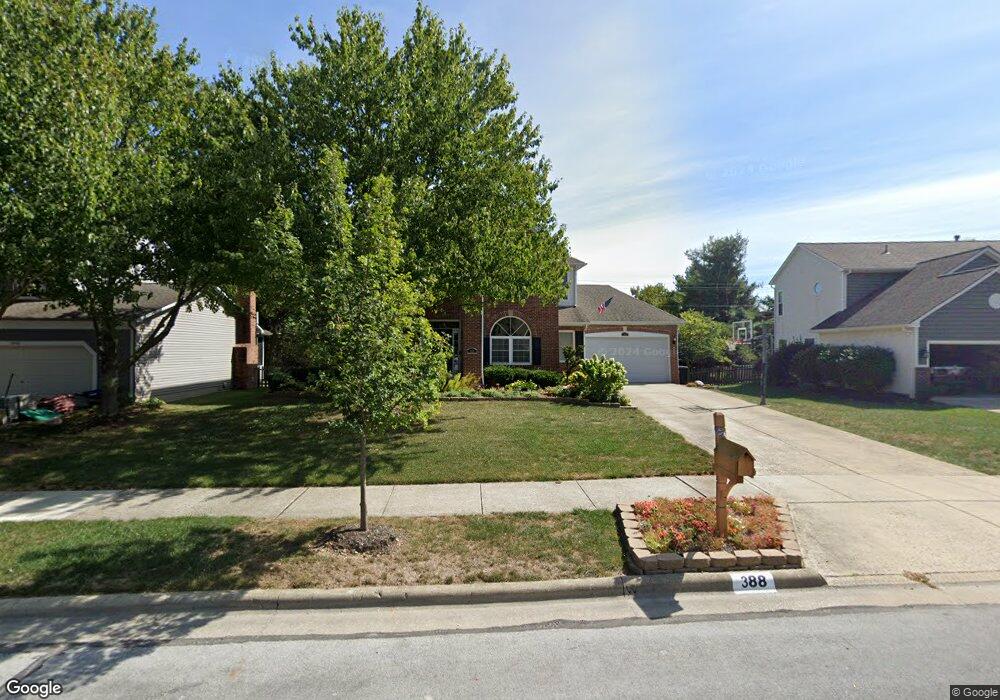
388 Canterbury Ct Westerville, OH 43082
Genoa NeighborhoodEstimated Value: $516,000 - $635,000
4
Beds
4
Baths
3,369
Sq Ft
$167/Sq Ft
Est. Value
About This Home
This home is located at 388 Canterbury Ct, Westerville, OH 43082 and is currently estimated at $561,640, approximately $166 per square foot. 388 Canterbury Ct is a home located in Delaware County with nearby schools including Whittier Elementary School, Genoa Middle School, and Westerville South High School.
Ownership History
Date
Name
Owned For
Owner Type
Purchase Details
Closed on
Jun 19, 2015
Sold by
Waltz Michael W and Waltz Melissa
Bought by
Jones Craig P and Jones Leanne M
Current Estimated Value
Home Financials for this Owner
Home Financials are based on the most recent Mortgage that was taken out on this home.
Original Mortgage
$274,550
Outstanding Balance
$213,176
Interest Rate
3.82%
Mortgage Type
New Conventional
Estimated Equity
$348,464
Purchase Details
Closed on
Aug 22, 2011
Sold by
Brash William T and Brash Anna R
Bought by
Waltz Michael W and Waltz Melissa
Home Financials for this Owner
Home Financials are based on the most recent Mortgage that was taken out on this home.
Original Mortgage
$242,910
Interest Rate
4.58%
Mortgage Type
New Conventional
Purchase Details
Closed on
Dec 17, 1996
Sold by
Tobin Bernard V
Bought by
Brash William T and Brash Anne M
Home Financials for this Owner
Home Financials are based on the most recent Mortgage that was taken out on this home.
Original Mortgage
$161,400
Interest Rate
7.85%
Mortgage Type
New Conventional
Create a Home Valuation Report for This Property
The Home Valuation Report is an in-depth analysis detailing your home's value as well as a comparison with similar homes in the area
Home Values in the Area
Average Home Value in this Area
Purchase History
| Date | Buyer | Sale Price | Title Company |
|---|---|---|---|
| Jones Craig P | $289,000 | None Available | |
| Waltz Michael W | $269,900 | Real Living Title Agency | |
| Brash William T | $188,500 | -- |
Source: Public Records
Mortgage History
| Date | Status | Borrower | Loan Amount |
|---|---|---|---|
| Open | Jones Craig P | $274,550 | |
| Closed | Waltz Michael W | $242,910 | |
| Closed | Brash William T | $161,400 |
Source: Public Records
Tax History Compared to Growth
Tax History
| Year | Tax Paid | Tax Assessment Tax Assessment Total Assessment is a certain percentage of the fair market value that is determined by local assessors to be the total taxable value of land and additions on the property. | Land | Improvement |
|---|---|---|---|---|
| 2024 | $7,898 | $155,020 | $30,870 | $124,150 |
| 2023 | $7,807 | $155,020 | $30,870 | $124,150 |
| 2022 | $7,710 | $118,440 | $21,140 | $97,300 |
| 2021 | $7,776 | $118,440 | $21,140 | $97,300 |
| 2020 | $7,828 | $118,440 | $21,140 | $97,300 |
| 2019 | $6,744 | $97,480 | $18,380 | $79,100 |
| 2018 | $6,630 | $97,480 | $18,380 | $79,100 |
| 2017 | $6,211 | $82,330 | $16,070 | $66,260 |
| 2016 | $6,110 | $82,330 | $16,070 | $66,260 |
| 2015 | $5,844 | $82,330 | $16,070 | $66,260 |
| 2014 | $5,903 | $82,330 | $16,070 | $66,260 |
| 2013 | $5,680 | $79,180 | $16,070 | $63,110 |
Source: Public Records
Map
Nearby Homes
- 547 County Line Rd
- 267 Windemere Place
- 175 Nottingham Ct
- 223 Dogwood Ln
- 348 Buck Run Trail
- 137 Abbeycross Ln
- 129 Abbeycross Ln Unit 129
- 150 Matthew Ave
- 114 Canterbrick Dr
- 718 Sugar Ct
- 364 E College Ave
- 368 E College Ave
- 66 Abbeycross Ln
- 389 Ridgemoor Ln
- 543 N State St
- 656 Olde Mill Dr
- 199 E College Ave
- 92 N Vine St
- 589 E College Ave
- 754 Kingsmead Rd Unit 18754
- 396 Canterbury Ct
- 382 Canterbury Ct
- 427 Rockbourne Dr
- 421 Rockbourne Dr
- 404 Canterbury Ct
- 376 Canterbury Ct
- 415 Rockbourne Dr
- 433 Rockbourne Dr
- 393 Canterbury Ct
- 383 Canterbury Ct
- 361 Olde English Dr
- 399 Canterbury Ct
- 410 Canterbury Ct
- 370 Canterbury Ct
- 439 Rockbourne Dr
- 375 Canterbury Ct
- 407 Canterbury Ct
- 367 Olde English Dr
- 445 Rockbourne Dr
- 366 Canterbury Ct