Estimated Value: $220,000 - $281,335
3
Beds
2
Baths
1,607
Sq Ft
$154/Sq Ft
Est. Value
About This Home
This home is located at 388 Dave Hogan Rd, Chula, GA 31733 and is currently estimated at $248,112, approximately $154 per square foot. 388 Dave Hogan Rd is a home located in Tift County with nearby schools including Len Lastinger Primary School, Matt Wilson Elementary School, and J.T. Reddick School.
Ownership History
Date
Name
Owned For
Owner Type
Purchase Details
Closed on
Mar 15, 2024
Sold by
Weldon Mitchell Lee
Bought by
Weldon Deidra and Lee Weldon Mitchell
Current Estimated Value
Purchase Details
Closed on
Apr 15, 2016
Sold by
Law Jeremy P
Bought by
Payne Kimberly Gandy and Gandy Bennie C
Home Financials for this Owner
Home Financials are based on the most recent Mortgage that was taken out on this home.
Original Mortgage
$128,000
Interest Rate
3.73%
Mortgage Type
New Conventional
Purchase Details
Closed on
Nov 22, 2010
Sold by
Sedlick Virginia H
Bought by
Law Jeremy P and Law Meghan E
Home Financials for this Owner
Home Financials are based on the most recent Mortgage that was taken out on this home.
Original Mortgage
$126,424
Interest Rate
4.3%
Mortgage Type
New Conventional
Purchase Details
Closed on
Mar 24, 2006
Sold by
Sedlick John J
Bought by
Sedlick Virginia
Create a Home Valuation Report for This Property
The Home Valuation Report is an in-depth analysis detailing your home's value as well as a comparison with similar homes in the area
Purchase History
| Date | Buyer | Sale Price | Title Company |
|---|---|---|---|
| Weldon Deidra | -- | -- | |
| Lee Weldon Mitchell | $245,000 | -- | |
| Payne Kimberly Gandy | $134,900 | -- | |
| Law Jeremy P | $126,000 | -- | |
| Sedlick Virginia H | -- | -- | |
| Sedlick Virginia | -- | -- |
Source: Public Records
Mortgage History
| Date | Status | Borrower | Loan Amount |
|---|---|---|---|
| Previous Owner | Payne Kimberly Gandy | $128,000 | |
| Previous Owner | Sedlick Virginia H | $126,424 |
Source: Public Records
Tax History
| Year | Tax Paid | Tax Assessment Tax Assessment Total Assessment is a certain percentage of the fair market value that is determined by local assessors to be the total taxable value of land and additions on the property. | Land | Improvement |
|---|---|---|---|---|
| 2024 | $1,570 | $58,884 | $4,808 | $54,076 |
| 2023 | $1,396 | $45,436 | $3,410 | $42,026 |
| 2022 | $1,351 | $45,523 | $3,410 | $42,113 |
| 2021 | $1,359 | $45,523 | $3,410 | $42,113 |
| 2020 | $1,385 | $45,523 | $3,410 | $42,113 |
| 2019 | $1,382 | $45,523 | $3,410 | $42,113 |
| 2018 | $1,380 | $45,523 | $3,410 | $42,113 |
| 2017 | $1,387 | $45,523 | $3,410 | $42,113 |
| 2016 | $1,388 | $45,523 | $3,410 | $42,113 |
| 2015 | $1,388 | $45,523 | $3,410 | $42,113 |
| 2014 | $1,377 | $45,049 | $3,410 | $41,639 |
| 2013 | -- | $45,048 | $3,410 | $41,638 |
Source: Public Records
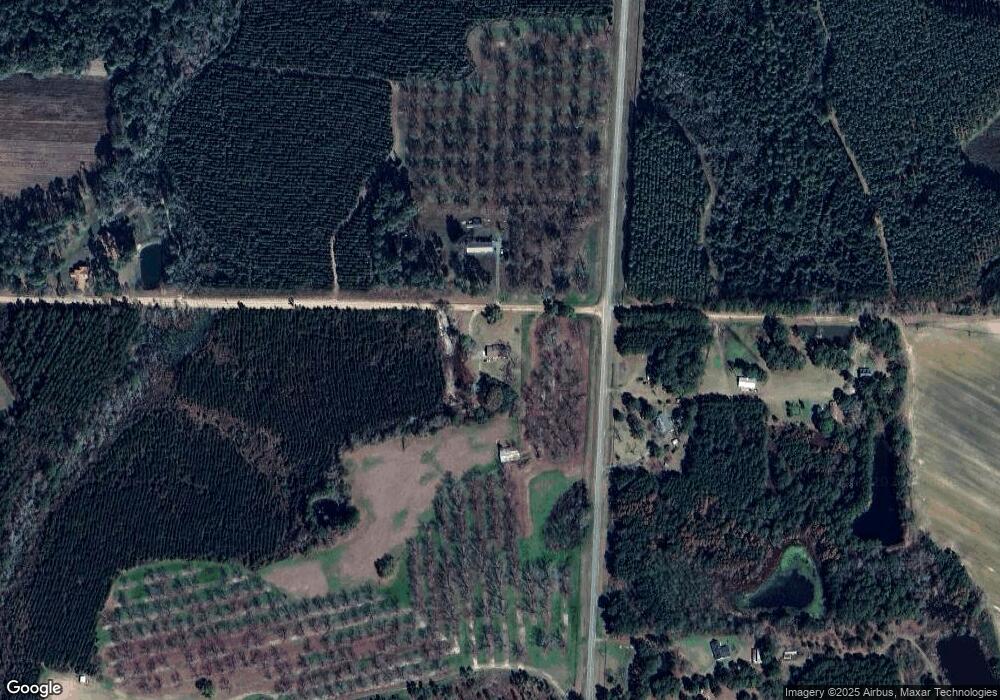
Map
Nearby Homes
- 357 Chula Brookfield Rd
- 136 S Access Rd
- 257 Adams Rd
- 18 Hank Mike Rd
- 746 Chula Brookfield Rd
- 795 Chula Brookfield Rd
- 64 Hank Mike Rd
- 50 Hank Mike Rd
- 37 Duane Dr
- 650 Clyatt Rd
- 87 Waterfront St
- 100 Long Pine Rd
- 50 Margaret Ln
- n/a Wiley Branch Rd
- 7013 Northgate Dr
- 142 Brighton Rd
- 0 Brighton Rd
- 0 Whiddon Mill Rd Unit 138931
- 0 Whiddon Mill Rd Unit 138434
- 00 Denham Rd