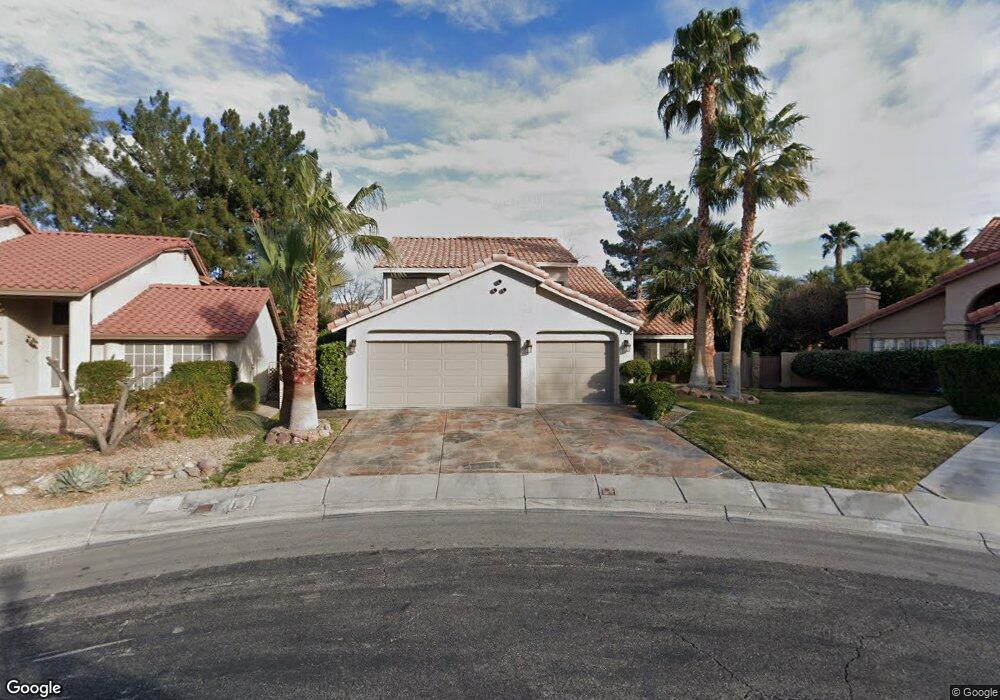
388 Decareo Ct Henderson, NV 89014
Green Valley North NeighborhoodEstimated Value: $586,000 - $604,000
3
Beds
3
Baths
2,481
Sq Ft
$238/Sq Ft
Est. Value
About This Home
This home is located at 388 Decareo Ct, Henderson, NV 89014 and is currently estimated at $591,301, approximately $238 per square foot. 388 Decareo Ct is a home located in Clark County with nearby schools including Estes M Mcdoniel Elementary School, Barbara and Hank Greenspun Junior High School, and Green Valley High School.
Ownership History
Date
Name
Owned For
Owner Type
Purchase Details
Closed on
Sep 27, 2021
Sold by
Robinson Brent E and Robinson Jessica A
Bought by
Robinson Brent E and Robinson Jessica A
Current Estimated Value
Purchase Details
Closed on
May 29, 2013
Sold by
Gresty Richard L
Bought by
Robinson Brent E and Robinson Jessica A
Home Financials for this Owner
Home Financials are based on the most recent Mortgage that was taken out on this home.
Original Mortgage
$227,797
Outstanding Balance
$160,809
Interest Rate
3.32%
Mortgage Type
FHA
Estimated Equity
$430,492
Purchase Details
Closed on
Jul 17, 2008
Sold by
Gresty Richard L and Gresty Karen R
Bought by
Gresty Richard L and Richard L Gresty Trust
Purchase Details
Closed on
Jan 9, 2004
Sold by
Vaughn Koral K and Vaughn Monica L
Bought by
Gresty Richard L and Gresty Karen R
Purchase Details
Closed on
Oct 25, 1996
Sold by
Overlock Donald Clark and Overlock Patricia Jean
Bought by
Vaughn Koral K and Vaughn Monica L
Home Financials for this Owner
Home Financials are based on the most recent Mortgage that was taken out on this home.
Original Mortgage
$174,300
Interest Rate
8.11%
Create a Home Valuation Report for This Property
The Home Valuation Report is an in-depth analysis detailing your home's value as well as a comparison with similar homes in the area
Home Values in the Area
Average Home Value in this Area
Purchase History
| Date | Buyer | Sale Price | Title Company |
|---|---|---|---|
| Robinson Brent E | -- | None Available | |
| Robinson Brent E | $232,000 | Chicago Title | |
| Gresty Richard L | -- | None Available | |
| Gresty Richard L | $320,000 | Fidelity National Title | |
| Vaughn Koral K | $183,500 | Nevada Title Company |
Source: Public Records
Mortgage History
| Date | Status | Borrower | Loan Amount |
|---|---|---|---|
| Open | Robinson Brent E | $227,797 | |
| Previous Owner | Vaughn Koral K | $174,300 |
Source: Public Records
Tax History Compared to Growth
Tax History
| Year | Tax Paid | Tax Assessment Tax Assessment Total Assessment is a certain percentage of the fair market value that is determined by local assessors to be the total taxable value of land and additions on the property. | Land | Improvement |
|---|---|---|---|---|
| 2025 | $2,221 | $117,098 | $41,160 | $75,938 |
| 2024 | $2,156 | $117,098 | $41,160 | $75,938 |
| 2023 | $2,156 | $110,207 | $37,118 | $73,089 |
| 2022 | $2,094 | $101,630 | $34,031 | $67,599 |
| 2021 | $2,033 | $93,221 | $28,298 | $64,923 |
| 2020 | $1,885 | $92,084 | $27,195 | $64,889 |
| 2019 | $1,766 | $91,460 | $27,195 | $64,265 |
| 2018 | $1,685 | $85,629 | $23,153 | $62,476 |
| 2017 | $2,462 | $84,930 | $20,948 | $63,982 |
| 2016 | $1,578 | $85,056 | $20,580 | $64,476 |
| 2015 | $1,575 | $65,449 | $11,025 | $54,424 |
| 2014 | $1,529 | $51,196 | $11,025 | $40,171 |
Source: Public Records
Map
Nearby Homes
- 372 Rushing Creek Ct
- 374 Santali Ct
- 1926 Navarre Ln
- 347 Gana Ct Unit B
- 1832 Muchacha Dr
- 2050 W Warm Springs Rd Unit 312
- 2050 W Warm Springs Rd Unit 4521
- 2050 W Warm Springs Rd Unit 1311
- 2050 W Warm Springs Rd Unit 3624
- 2050 W Warm Springs Rd Unit 224
- 2050 W Warm Springs Rd Unit 411
- 322 Oliveiro Ct
- 2220 Marlboro Dr
- 327 Fuente Dr
- 439 Indigo Springs St
- 451 Indigo Springs St
- 1743 Stagecoach Dr
- 1742 Stagecoach Dr
- 1810 Nuevo Rd
- 316 Santa Monica Dr
- 386 Decareo Ct
- 390 Decareo Ct
- 1923 Magnolia Dr
- 1921 Magnolia Dr
- 1925 Magnolia Dr
- 392 Decareo Ct
- 1919 Magnolia Dr
- 1906 Old Mill Ln
- 1908 Old Mill Ln
- 387 Decareo Ct
- 1904 Old Mill Ln
- 1910 Old Mill Ln
- 1902 Old Mill Ln
- 394 Decareo Ct
- 394 Decareo Ct Unit 1
- 389 Decareo Ct
- 1912 Old Mill Ln
- 391 Decareo Ct
- 1917 Magnolia Dr
- 1900 Old Mill Ln