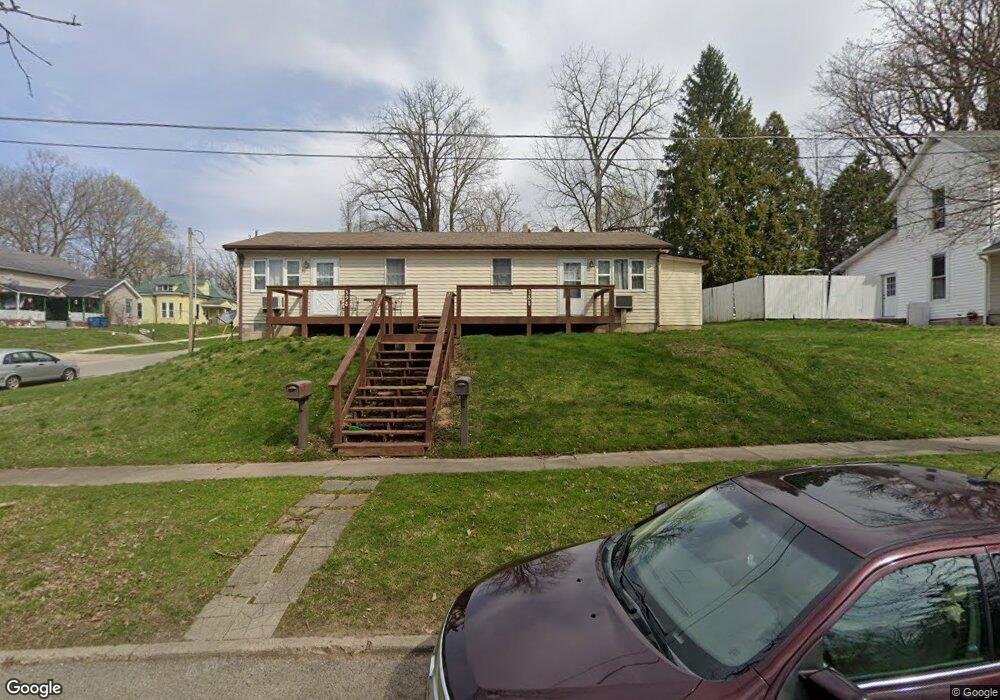
388 Ferry St Wabash, IN 46992
Estimated Value: $115,000 - $141,000
4
Beds
2
Baths
1,248
Sq Ft
$101/Sq Ft
Est. Value
About This Home
This home is located at 388 Ferry St, Wabash, IN 46992 and is currently estimated at $126,513, approximately $101 per square foot. 388 Ferry St is a home located in Wabash County with nearby schools including O.J. Neighbours Elementary School, W C Mills Elementary School, and Wabash Middle School.
Ownership History
Date
Name
Owned For
Owner Type
Purchase Details
Closed on
Nov 7, 2018
Sold by
Metz James J
Bought by
Bouse Jonathan L
Current Estimated Value
Home Financials for this Owner
Home Financials are based on the most recent Mortgage that was taken out on this home.
Original Mortgage
$62,700
Outstanding Balance
$55,019
Interest Rate
4.7%
Mortgage Type
New Conventional
Estimated Equity
$71,494
Create a Home Valuation Report for This Property
The Home Valuation Report is an in-depth analysis detailing your home's value as well as a comparison with similar homes in the area
Home Values in the Area
Average Home Value in this Area
Purchase History
| Date | Buyer | Sale Price | Title Company |
|---|---|---|---|
| Bouse Jonathan L | $66,000 | -- | |
| Bouse Jonathan L | $66,000 | Metz Title Company, Inc |
Source: Public Records
Mortgage History
| Date | Status | Borrower | Loan Amount |
|---|---|---|---|
| Open | Bouse Jonathan L | $62,700 |
Source: Public Records
Tax History
| Year | Tax Paid | Tax Assessment Tax Assessment Total Assessment is a certain percentage of the fair market value that is determined by local assessors to be the total taxable value of land and additions on the property. | Land | Improvement |
|---|---|---|---|---|
| 2024 | $1,812 | $90,600 | $12,200 | $78,400 |
| 2023 | $1,788 | $89,100 | $12,200 | $76,900 |
| 2022 | $1,015 | $77,100 | $12,200 | $64,900 |
| 2021 | $917 | $70,800 | $12,200 | $58,600 |
| 2020 | $862 | $67,000 | $12,200 | $54,800 |
| 2019 | $812 | $65,400 | $12,200 | $53,200 |
| 2018 | $783 | $63,100 | $12,200 | $50,900 |
| 2017 | $1,229 | $60,000 | $12,200 | $47,800 |
| 2016 | $1,248 | $60,600 | $12,200 | $48,400 |
| 2014 | $1,174 | $61,100 | $12,200 | $48,900 |
| 2013 | $1,212 | $60,100 | $12,200 | $47,900 |
Source: Public Records
Map
Nearby Homes