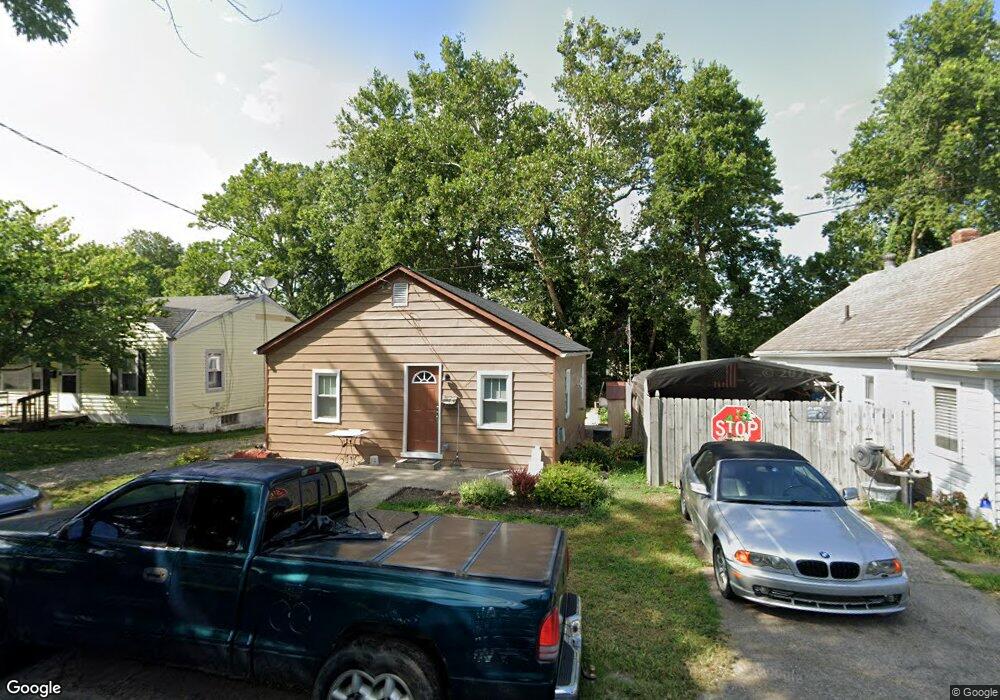
388 Harding St South Lebanon, OH 45065
Estimated Value: $163,300 - $188,000
2
Beds
1
Bath
962
Sq Ft
$184/Sq Ft
Est. Value
About This Home
This home is located at 388 Harding St, South Lebanon, OH 45065 and is currently estimated at $176,825, approximately $183 per square foot. 388 Harding St is a home located in Warren County with nearby schools including Kings Junior High School, Kings High School, and Lebanon Christian Schools.
Ownership History
Date
Name
Owned For
Owner Type
Purchase Details
Closed on
Sep 21, 1999
Sold by
Galyen Paul
Bought by
Souza Patricia J
Current Estimated Value
Home Financials for this Owner
Home Financials are based on the most recent Mortgage that was taken out on this home.
Original Mortgage
$70,731
Outstanding Balance
$22,625
Interest Rate
7.93%
Mortgage Type
FHA
Estimated Equity
$154,200
Purchase Details
Closed on
Dec 17, 1990
Sold by
Poindexter Poindexter and Poindexter Walter
Bought by
Galyen Galyen and Galyen Paul W
Purchase Details
Closed on
Nov 5, 1990
Sold by
Martin Poindexter and Martin Thomas
Bought by
Poindexter Poindexter and Poindexter Walter
Purchase Details
Closed on
Aug 25, 1988
Sold by
Poindexter Poindexter and Poindexter Veretta
Bought by
Martin Poindexter and Martin Thomas
Create a Home Valuation Report for This Property
The Home Valuation Report is an in-depth analysis detailing your home's value as well as a comparison with similar homes in the area
Home Values in the Area
Average Home Value in this Area
Purchase History
| Date | Buyer | Sale Price | Title Company |
|---|---|---|---|
| Souza Patricia J | $79,000 | -- | |
| Galyen Galyen | $43,000 | -- | |
| Poindexter Poindexter | -- | -- | |
| Martin Poindexter | -- | -- |
Source: Public Records
Mortgage History
| Date | Status | Borrower | Loan Amount |
|---|---|---|---|
| Open | Souva Patricia | $16,633 | |
| Open | Souza Patricia J | $70,731 |
Source: Public Records
Tax History Compared to Growth
Tax History
| Year | Tax Paid | Tax Assessment Tax Assessment Total Assessment is a certain percentage of the fair market value that is determined by local assessors to be the total taxable value of land and additions on the property. | Land | Improvement |
|---|---|---|---|---|
| 2024 | $1,347 | $35,800 | $9,220 | $26,580 |
| 2023 | $1,128 | $28,290 | $4,266 | $24,024 |
| 2022 | $1,114 | $28,291 | $4,267 | $24,024 |
| 2021 | $934 | $28,291 | $4,267 | $24,024 |
| 2020 | $795 | $22,631 | $3,413 | $19,219 |
| 2019 | $806 | $22,631 | $3,413 | $19,219 |
| 2018 | $725 | $22,631 | $3,413 | $19,219 |
| 2017 | $1,226 | $18,858 | $2,888 | $15,971 |
| 2016 | $1,183 | $18,858 | $2,888 | $15,971 |
| 2015 | $1,070 | $18,858 | $2,888 | $15,971 |
| 2014 | $1,131 | $18,860 | $2,890 | $15,970 |
| 2013 | $1,122 | $22,300 | $3,410 | $18,890 |
Source: Public Records
Map
Nearby Homes
- 3709 Dry Run Rd
- 278 Ilene Ave
- 95 E Mckinley St
- 401 Mary Ln
- 4595 Kibbey Ln
- 507 Shawhan Rd
- 3876 Snook Rd
- 668 Shawhan Rd
- 4825 Lakeview Ct
- 329 Stone Ridge Blvd
- 884 River Forest Dr
- 219 Chateau Valley Ln
- 22 Snook Rd
- 385 Glen Abbey Ln
- 367 Glen Abbey Ln
- 373 Glen Abbey Ln
- Keating Plan at Cypress Pointe
- 379 Glen Abbey Ln
- 5096 Riverview Dr
- 5087 Emerald View Dr
- 396 Harding St
- 380 Harding St
- 370 1/2 Harding St
- 408 Harding St
- 395 Harding St
- 3929 Lebanon Rd
- 3875 Lebanon Rd
- 424 Harding St
- 3924 Hudson Ave
- 3873 Lebanon Rd
- 3873 Lebanon Rd Unit 3875
- 3932 Hudson Ave
- 496 Lebanon Rd
- 3937 Lebanon Rd
- 488 Lebanon Rd
- 440 Harding St
- 3951 Lebanon Rd
- 3946 Hudson Ave
- 3897 Hudson Ave
- 3959 Lebanon Rd