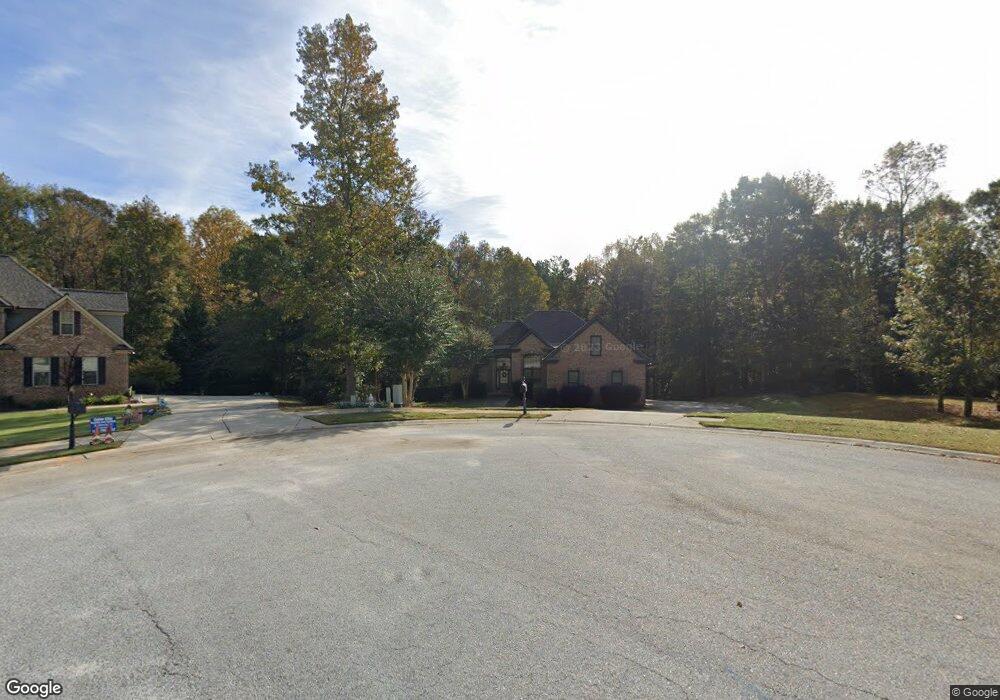
388 Hidden Trail Pendergrass, GA 30567
Estimated Value: $499,896 - $600,000
6
Beds
5
Baths
2,622
Sq Ft
$211/Sq Ft
Est. Value
About This Home
This home is located at 388 Hidden Trail, Pendergrass, GA 30567 and is currently estimated at $554,474, approximately $211 per square foot. 388 Hidden Trail is a home located in Jackson County with nearby schools including West Jackson Elementary School, West Jackson Middle School, and Jackson County High School.
Ownership History
Date
Name
Owned For
Owner Type
Purchase Details
Closed on
Sep 16, 2011
Sold by
Garib Ravi
Bought by
Primm Nicholas
Current Estimated Value
Home Financials for this Owner
Home Financials are based on the most recent Mortgage that was taken out on this home.
Original Mortgage
$182,800
Outstanding Balance
$9,485
Interest Rate
4.24%
Mortgage Type
New Conventional
Estimated Equity
$544,989
Purchase Details
Closed on
Jan 30, 2007
Sold by
Not Provided
Bought by
Sohan Urvashi and Ravi Garib
Home Financials for this Owner
Home Financials are based on the most recent Mortgage that was taken out on this home.
Original Mortgage
$340,934
Interest Rate
6.17%
Mortgage Type
New Conventional
Purchase Details
Closed on
Mar 20, 2006
Sold by
Not Provided
Bought by
Sohan Urvashi and Ravi Garib
Create a Home Valuation Report for This Property
The Home Valuation Report is an in-depth analysis detailing your home's value as well as a comparison with similar homes in the area
Home Values in the Area
Average Home Value in this Area
Purchase History
| Date | Buyer | Sale Price | Title Company |
|---|---|---|---|
| Primm Nicholas | $228,500 | -- | |
| Sohan Urvashi | $341,000 | -- | |
| Sohan Urvashi | $55,158 | -- |
Source: Public Records
Mortgage History
| Date | Status | Borrower | Loan Amount |
|---|---|---|---|
| Open | Primm Nicholas | $182,800 | |
| Previous Owner | Sohan Urvashi | $340,934 |
Source: Public Records
Tax History
| Year | Tax Paid | Tax Assessment Tax Assessment Total Assessment is a certain percentage of the fair market value that is determined by local assessors to be the total taxable value of land and additions on the property. | Land | Improvement |
|---|---|---|---|---|
| 2025 | $4,868 | $212,040 | $50,000 | $162,040 |
| 2024 | $4,868 | $182,840 | $20,800 | $162,040 |
| 2023 | $4,393 | $165,320 | $20,800 | $144,520 |
| 2022 | $3,851 | $137,560 | $20,800 | $116,760 |
| 2021 | $3,609 | $127,960 | $11,200 | $116,760 |
| 2020 | $3,317 | $107,120 | $11,200 | $95,920 |
| 2019 | $3,367 | $107,120 | $11,200 | $95,920 |
| 2018 | $3,269 | $102,520 | $11,200 | $91,320 |
| 2017 | $3,092 | $96,026 | $11,200 | $84,826 |
| 2016 | $3,109 | $96,026 | $11,200 | $84,826 |
| 2015 | $3,123 | $96,026 | $11,200 | $84,826 |
| 2014 | $3,097 | $94,484 | $11,200 | $83,284 |
| 2013 | -- | $94,484 | $11,200 | $83,284 |
Source: Public Records
Map
Nearby Homes
- 121 Hewett Rd
- 37 Sealy Place
- 749 Hubert Pittman Tract 3 Rd
- 749 Hubert Pittman Rd Unit TRACT 2
- 749 Hubert Pittman Rd Unit TRACT 2 AND 3
- 749 Hubert Pittman Rd
- 749 Hubert Pittman Rd Unit TRACT 3
- 749 Hubert Pittman Tract 2 Rd
- 00 Route 60
- 647 Fairview Rd
- 45 River Chase
- 114 River Bluff
- 154 River Branch Way
- 411 Meadow Lake Terrace
- 96 William Freeman Rd
- 787 Reece Dr
- 1273 Highway 60
- 693 Reece Dr
- 0 Guy Cooper Rd Unit 10545221
- 367 Hughes Ln
- 398 Hidden Trail
- 377 Hidden Trail
- 348 Hidden Trail
- 397 Hidden Trail
- 357 Hidden Trail
- 333 Hidden Trail
- 298 Hidden Trail
- 170 Hewett Rd
- 315 Hidden Trail
- 163 Hewett Rd
- 289 Hidden Trail
- 289 Hidden Trail Unit 11
- 278 Hidden Trail
- 149 Hewett Rd
- 254 Hidden Trail
- 158 Hewett Rd
- 267 Hidden Trail
- 267 Hidden Trail Unit 10
- 149 Sealy Place
- 235 Hidden Trail
Your Personal Tour Guide
Ask me questions while you tour the home.