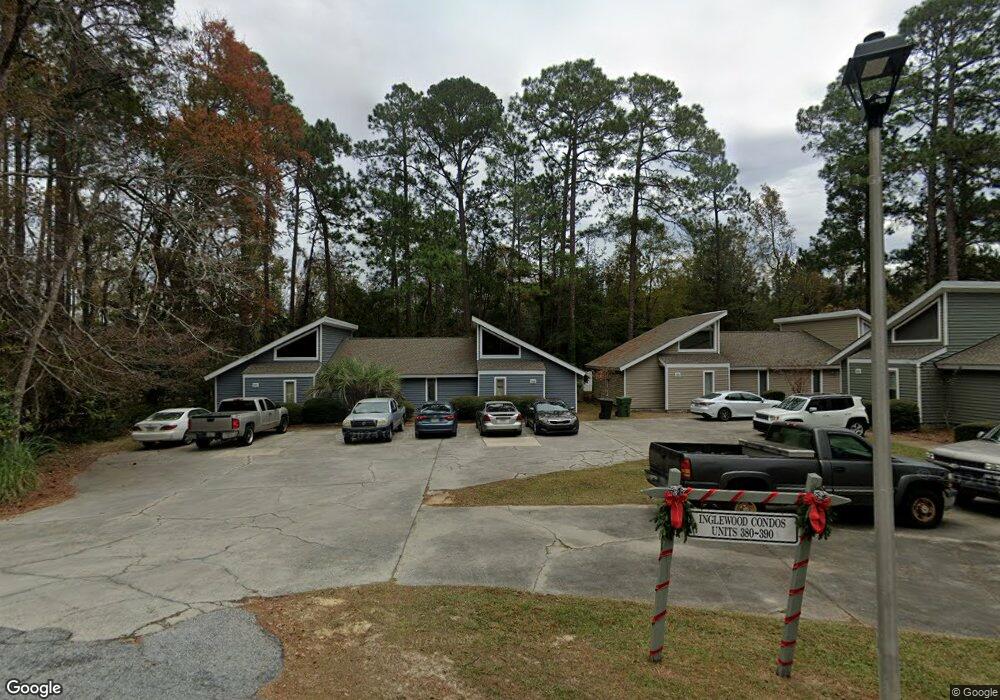
388 Hummingbird Cir Statesboro, GA 30458
Estimated Value: $128,238 - $146,000
2
Beds
2
Baths
1,025
Sq Ft
$136/Sq Ft
Est. Value
About This Home
This home is located at 388 Hummingbird Cir, Statesboro, GA 30458 and is currently estimated at $139,060, approximately $135 per square foot. 388 Hummingbird Cir is a home located in Bulloch County with nearby schools including Statesboro High School, Mill Creek Elementary School, and Langston Chapel Middle School.
Ownership History
Date
Name
Owned For
Owner Type
Purchase Details
Closed on
Jul 3, 2019
Sold by
Mitchell Kenneth Wilson
Bought by
January Ginny Marie
Current Estimated Value
Purchase Details
Closed on
Feb 15, 2018
Sold by
Cates
Bought by
Wilson January Ginny Marie and Wilson Mitchell Kenneth
Purchase Details
Closed on
Jul 18, 2017
Sold by
Durrence Gregory
Bought by
Cates
Purchase Details
Closed on
Jan 8, 2007
Sold by
Not Provided
Bought by
Durrence Gregory and Durrence Wanda S
Home Financials for this Owner
Home Financials are based on the most recent Mortgage that was taken out on this home.
Original Mortgage
$67,450
Interest Rate
6.05%
Mortgage Type
New Conventional
Purchase Details
Closed on
Jul 29, 2004
Bought by
Green Amy L
Purchase Details
Closed on
Mar 19, 2004
Bought by
Green Amy L
Purchase Details
Closed on
Feb 1, 2003
Bought by
Elko Lisa R
Purchase Details
Closed on
Sep 1, 1993
Bought by
Murphy Cecil
Create a Home Valuation Report for This Property
The Home Valuation Report is an in-depth analysis detailing your home's value as well as a comparison with similar homes in the area
Home Values in the Area
Average Home Value in this Area
Purchase History
| Date | Buyer | Sale Price | Title Company |
|---|---|---|---|
| January Ginny Marie | -- | -- | |
| Wilson January Ginny Marie | $73,000 | -- | |
| Cates | $50,000 | -- | |
| Durrence Gregory | $71,000 | -- | |
| Green Amy L | -- | -- | |
| Green Amy L | -- | -- | |
| Elko Lisa R | -- | -- | |
| Murphy Cecil | -- | -- |
Source: Public Records
Mortgage History
| Date | Status | Borrower | Loan Amount |
|---|---|---|---|
| Previous Owner | Durrence Gregory | $67,450 |
Source: Public Records
Tax History Compared to Growth
Tax History
| Year | Tax Paid | Tax Assessment Tax Assessment Total Assessment is a certain percentage of the fair market value that is determined by local assessors to be the total taxable value of land and additions on the property. | Land | Improvement |
|---|---|---|---|---|
| 2024 | $1,012 | $36,920 | $3,200 | $33,720 |
| 2023 | $660 | $30,960 | $3,200 | $27,760 |
| 2022 | $464 | $23,639 | $3,200 | $20,439 |
| 2021 | $414 | $20,532 | $3,200 | $17,332 |
| 2020 | $485 | $23,384 | $3,200 | $20,184 |
| 2019 | $564 | $27,035 | $3,200 | $23,835 |
| 2018 | $435 | $25,957 | $3,200 | $22,757 |
| 2017 | $575 | $26,120 | $3,200 | $22,920 |
| 2016 | $567 | $25,113 | $3,200 | $21,913 |
| 2015 | $548 | $24,157 | $3,200 | $20,957 |
| 2014 | $503 | $24,157 | $3,200 | $20,957 |
Source: Public Records
Map
Nearby Homes
- 0 Hwy 301 Bypass and Jones Mill Rd Unit 10516580
- 0 E Main St Unit 10464174
- 112 Stratford St
- 0 Green Ridge Ct Unit 40 8990863
- 0 Northside Dr E Unit 10610985
- 306 Somera Ln
- 309 Somera Ln
- 313 Somera Ln
- 103 Scotdale Ct
- 118 Lee St
- 6 Carmel Dr
- 107 Bel Air Dr
- 362 Savannah Ave
- The Loblolly Plan at Belair East
- The Cypress Plan at Belair East
- The Dogwood Plan at Belair East
- The Holly Plan at Belair East
- The Birch Plan at Belair East
- The Aspen Plan at Belair East
- The Magnolia Plan at Belair East
- 386 Hummingbird Cir
- 390 Hummingbird Cir
- 384 Hummingbird Cir
- 384 Hummingbird Cir Unit 303
- 382 Hummingbird Cir
- 380 Hummingbird Cir
- 446 Lantana Cir
- 370 Hummingbird Cir
- 370 Hummingbird Cir Unit 221
- 368 Hummingbird Cir
- 372 Hummingbird Cir
- 366 Hummingbird Cir
- 374 Hummingbird Cir
- 374 Hummingbird Cir
- 501 Juniper Way
- 364 Hummingbird Cir
- 376 Hummingbird Cir
- 376 Hummingbird Cir Unit 224
- 362 Hummingbird Cir
- 505 Juniper Way