388 Lowell Rd Concord, MA 01742
Estimated Value: $2,485,000 - $3,153,000
3
Beds
3
Baths
3,545
Sq Ft
$778/Sq Ft
Est. Value
About This Home
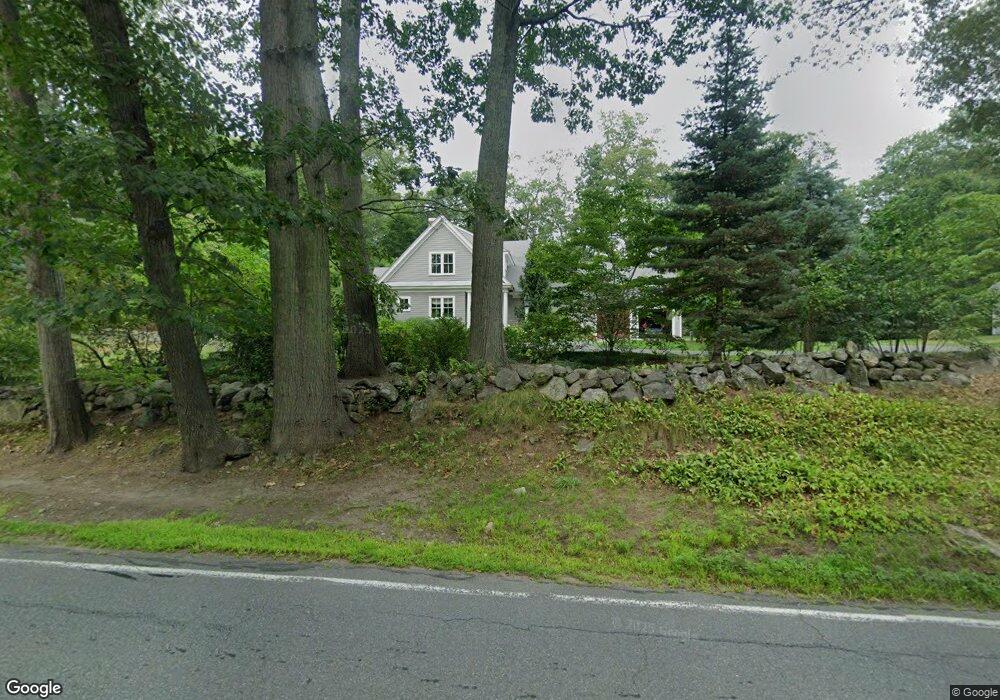
This home is located at 388 Lowell Rd, Concord, MA 01742 and is currently estimated at $2,758,130, approximately $778 per square foot. 388 Lowell Rd is a home located in Middlesex County with nearby schools including Alcott Elementary School, Concord Middle School, and Concord Carlisle High School.
Ownership History
Date
Name
Owned For
Owner Type
Purchase Details
Closed on
Oct 24, 2011
Sold by
Hurley Kevin P
Bought by
Lowell 388 Nt and Glenn Nea W
Current Estimated Value
Purchase Details
Closed on
Feb 14, 2007
Sold by
Munroe-Conners Robin and Conners Michael
Bought by
Hurley Kevin P
Home Financials for this Owner
Home Financials are based on the most recent Mortgage that was taken out on this home.
Original Mortgage
$460,000
Interest Rate
8%
Mortgage Type
Purchase Money Mortgage
Purchase Details
Closed on
Feb 28, 2006
Sold by
Atherton Charles A and Atherton Susan C
Bought by
Conners Michael and Conners Robin Munroe
Purchase Details
Closed on
Jun 29, 1994
Sold by
Muller Thomas E and Levitan Barbara J
Bought by
Atherton Charles A and Atherton Susan C
Home Financials for this Owner
Home Financials are based on the most recent Mortgage that was taken out on this home.
Original Mortgage
$305,000
Interest Rate
8.55%
Mortgage Type
Purchase Money Mortgage
Create a Home Valuation Report for This Property
The Home Valuation Report is an in-depth analysis detailing your home's value as well as a comparison with similar homes in the area
Home Values in the Area
Average Home Value in this Area
Purchase History
| Date | Buyer | Sale Price | Title Company |
|---|---|---|---|
| Lowell 388 Nt | $1,443,000 | -- | |
| Hurley Kevin P | $575,000 | -- | |
| Conners Michael | $625,000 | -- | |
| Atherton Charles A | $339,000 | -- |
Source: Public Records
Mortgage History
| Date | Status | Borrower | Loan Amount |
|---|---|---|---|
| Previous Owner | Atherton Charles A | $100,000 | |
| Previous Owner | Hurley Kevin P | $460,000 | |
| Previous Owner | Atherton Charles A | $337,500 | |
| Previous Owner | Atherton Charles A | $323,000 | |
| Previous Owner | Atherton Charles A | $305,000 |
Source: Public Records
Tax History Compared to Growth
Tax History
| Year | Tax Paid | Tax Assessment Tax Assessment Total Assessment is a certain percentage of the fair market value that is determined by local assessors to be the total taxable value of land and additions on the property. | Land | Improvement |
|---|---|---|---|---|
| 2025 | $272 | $2,051,300 | $590,700 | $1,460,600 |
| 2024 | $26,645 | $2,029,300 | $590,700 | $1,438,600 |
| 2023 | $22,003 | $1,697,800 | $537,000 | $1,160,800 |
| 2022 | $22,106 | $1,497,700 | $429,500 | $1,068,200 |
| 2021 | $21,541 | $1,463,400 | $429,500 | $1,033,900 |
| 2020 | $21,304 | $1,497,100 | $429,500 | $1,067,600 |
| 2019 | $18,983 | $1,337,800 | $396,300 | $941,500 |
| 2018 | $19,114 | $1,337,600 | $397,200 | $940,400 |
| 2017 | $18,634 | $1,324,400 | $406,600 | $917,800 |
| 2016 | $18,547 | $1,332,400 | $387,700 | $944,700 |
| 2015 | $17,537 | $1,227,200 | $358,900 | $868,300 |
Source: Public Records
Map
Nearby Homes