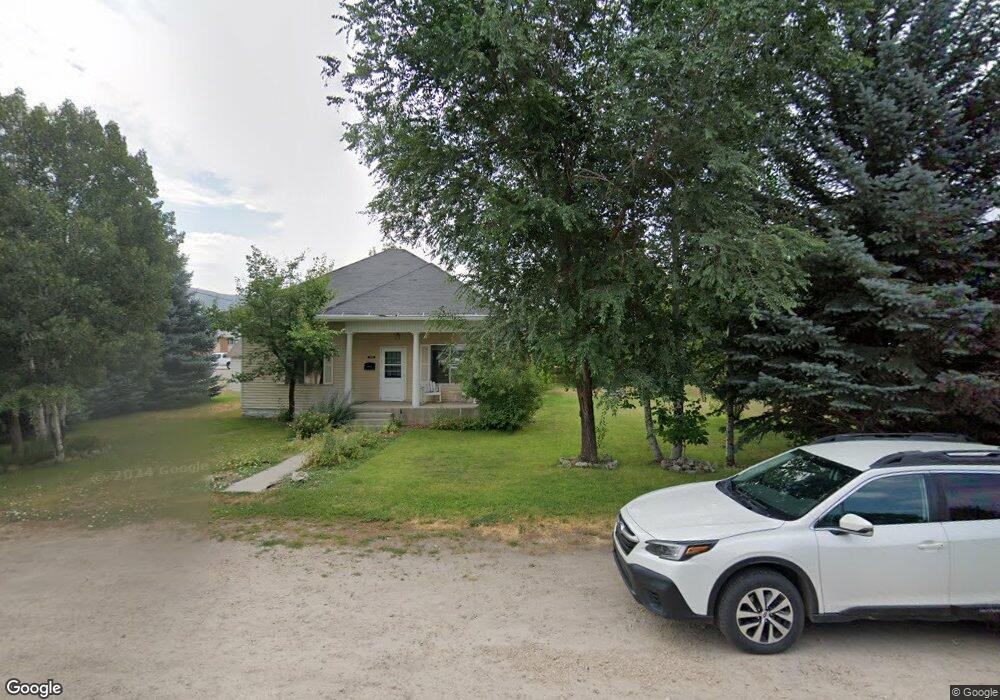
388 N 200 E Heber City, UT 84032
Estimated Value: $475,000 - $501,000
2
Beds
1
Bath
960
Sq Ft
$505/Sq Ft
Est. Value
About This Home
This home is located at 388 N 200 E, Heber City, UT 84032 and is currently estimated at $485,090, approximately $505 per square foot. 388 N 200 E is a home located in Wasatch County with nearby schools including J.R. Smith Elementary School and Wasatch High School.
Ownership History
Date
Name
Owned For
Owner Type
Purchase Details
Closed on
Dec 23, 2008
Sold by
Shaul Edwin H
Bought by
Shaul Edwin H
Current Estimated Value
Home Financials for this Owner
Home Financials are based on the most recent Mortgage that was taken out on this home.
Original Mortgage
$90,000
Outstanding Balance
$22,942
Interest Rate
6.1%
Mortgage Type
New Conventional
Estimated Equity
$462,148
Purchase Details
Closed on
Oct 26, 2005
Sold by
Mangelson Paul and Smith Rosario
Bought by
Shaul Edwin H
Create a Home Valuation Report for This Property
The Home Valuation Report is an in-depth analysis detailing your home's value as well as a comparison with similar homes in the area
Home Values in the Area
Average Home Value in this Area
Purchase History
| Date | Buyer | Sale Price | Title Company |
|---|---|---|---|
| Shaul Edwin H | -- | Founders Title Company Heber | |
| Shaul Edwin H | -- | Founders Title Company Heber |
Source: Public Records
Mortgage History
| Date | Status | Borrower | Loan Amount |
|---|---|---|---|
| Open | Shaul Edwin H | $90,000 |
Source: Public Records
Tax History Compared to Growth
Tax History
| Year | Tax Paid | Tax Assessment Tax Assessment Total Assessment is a certain percentage of the fair market value that is determined by local assessors to be the total taxable value of land and additions on the property. | Land | Improvement |
|---|---|---|---|---|
| 2025 | $1,857 | $441,944 | $240,000 | $201,944 |
| 2024 | $1,857 | $364,930 | $240,000 | $124,930 |
| 2023 | $1,857 | $377,551 | $125,000 | $252,551 |
| 2022 | $2,101 | $377,551 | $125,000 | $252,551 |
| 2021 | $2,016 | $287,748 | $114,000 | $173,748 |
| 2020 | $1,887 | $262,244 | $115,000 | $147,244 |
| 2019 | $1,617 | $130,484 | $0 | $0 |
| 2018 | $1,245 | $100,487 | $0 | $0 |
| 2017 | $1,118 | $89,712 | $0 | $0 |
| 2016 | $1,022 | $79,896 | $0 | $0 |
| 2015 | $811 | $66,497 | $0 | $0 |
| 2014 | $819 | $66,497 | $0 | $0 |
Source: Public Records
Map
Nearby Homes