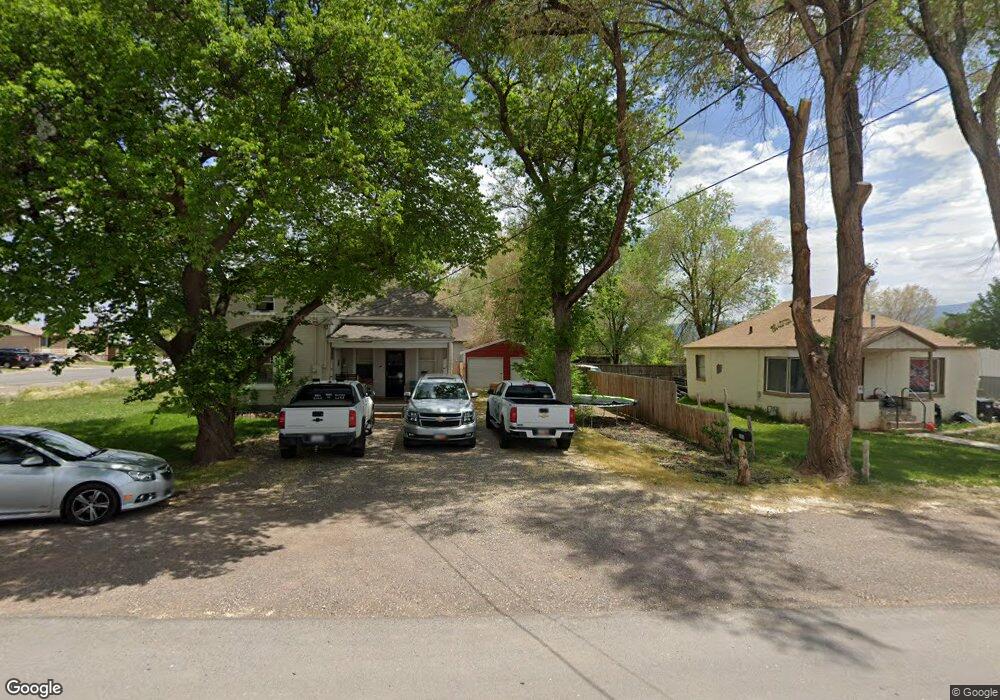
388 N 200 E Richfield, UT 84701
Estimated Value: $213,000 - $267,000
3
Beds
1
Bath
1,645
Sq Ft
$148/Sq Ft
Est. Value
About This Home
This home is located at 388 N 200 E, Richfield, UT 84701 and is currently estimated at $243,422, approximately $147 per square foot. 388 N 200 E is a home located in Sevier County with nearby schools including Pahvant School, Ashman School, and Red Hills Middle School.
Ownership History
Date
Name
Owned For
Owner Type
Purchase Details
Closed on
Apr 23, 2020
Sold by
Barney Jacqueline and Barney Shaun
Bought by
Pierson Richard and Nocon Casey
Current Estimated Value
Home Financials for this Owner
Home Financials are based on the most recent Mortgage that was taken out on this home.
Original Mortgage
$135,009
Outstanding Balance
$120,736
Interest Rate
4.25%
Mortgage Type
FHA
Estimated Equity
$122,686
Purchase Details
Closed on
May 16, 2017
Sold by
Cowley Justin
Bought by
Barney Jacqueline and Barney Shaun
Home Financials for this Owner
Home Financials are based on the most recent Mortgage that was taken out on this home.
Original Mortgage
$55,011
Interest Rate
4.1%
Mortgage Type
New Conventional
Purchase Details
Closed on
Aug 27, 2011
Sold by
Max White & Sons
Bought by
Cowley Justin
Create a Home Valuation Report for This Property
The Home Valuation Report is an in-depth analysis detailing your home's value as well as a comparison with similar homes in the area
Purchase History
| Date | Buyer | Sale Price | Title Company |
|---|---|---|---|
| Pierson Richard | -- | First American Ttl Richfield | |
| Barney Jacqueline | -- | Utah Title | |
| Cowley Justin | -- | -- |
Source: Public Records
Mortgage History
| Date | Status | Borrower | Loan Amount |
|---|---|---|---|
| Open | Pierson Richard | $135,009 | |
| Previous Owner | Barney Jacqueline | $55,011 |
Source: Public Records
Tax History
| Year | Tax Paid | Tax Assessment Tax Assessment Total Assessment is a certain percentage of the fair market value that is determined by local assessors to be the total taxable value of land and additions on the property. | Land | Improvement |
|---|---|---|---|---|
| 2025 | $1,171 | $120,578 | $38,030 | $82,548 |
| 2024 | $1,171 | $124,894 | $31,402 | $93,492 |
| 2023 | $1,236 | $136,192 | $29,074 | $107,118 |
| 2022 | $1,223 | $111,652 | $24,189 | $87,463 |
| 2021 | $1,127 | $86,634 | $25,395 | $61,239 |
| 2020 | $888 | $61,486 | $17,820 | $43,666 |
| 2019 | $696 | $55,080 | $14,850 | $40,230 |
| 2018 | $673 | $47,660 | $14,850 | $32,810 |
| 2017 | $654 | $44,230 | $14,850 | $29,380 |
| 2016 | $463 | $44,230 | $0 | $0 |
| 2015 | $463 | $36,920 | $0 | $0 |
| 2014 | $463 | $35,100 | $0 | $0 |
Source: Public Records
Map
Nearby Homes
Your Personal Tour Guide
Ask me questions while you tour the home.