Estimated Value: $358,000 - $436,000
--
Bed
--
Bath
--
Sq Ft
0.31
Acres
About This Home
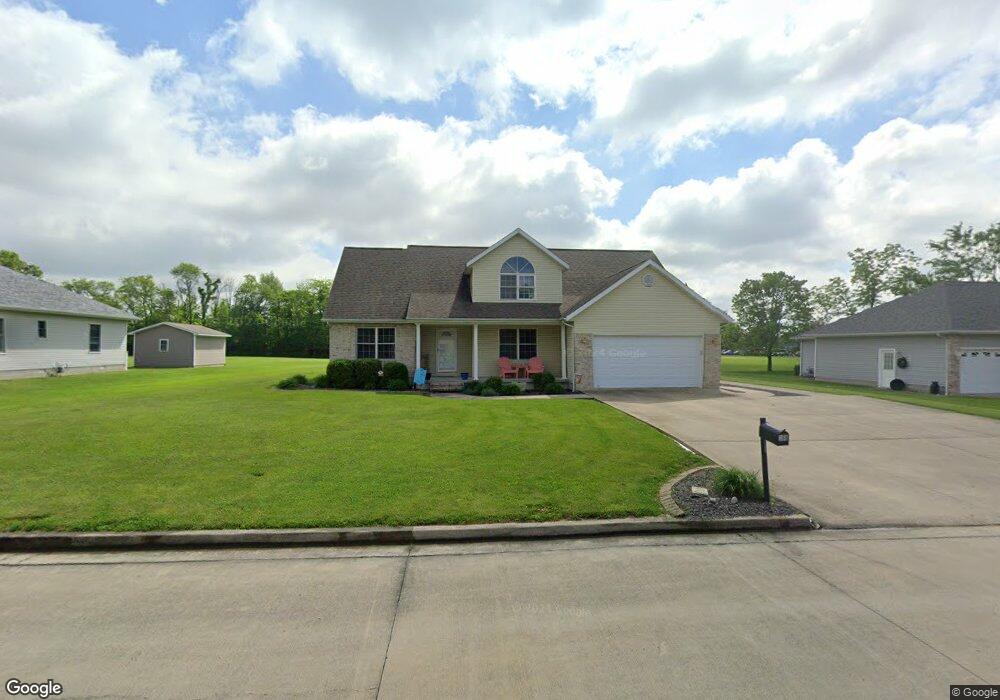
This home is located at 388 N Point Rd, Salem, IL 62881 and is currently estimated at $394,615. 388 N Point Rd is a home located in Marion County with nearby schools including Franklin Park Middle School, Hawthorn Elementary School, and Salem Community High School.
Ownership History
Date
Name
Owned For
Owner Type
Purchase Details
Closed on
Jun 26, 2024
Sold by
John W Dietrich W and John Deborah L
Bought by
Boldt Lance E and Boldt Brittany E
Current Estimated Value
Home Financials for this Owner
Home Financials are based on the most recent Mortgage that was taken out on this home.
Original Mortgage
$341,525
Outstanding Balance
$337,469
Interest Rate
7.02%
Mortgage Type
New Conventional
Estimated Equity
$57,146
Purchase Details
Closed on
Dec 18, 2023
Sold by
Dietrich Deborah L
Bought by
John W Dietrich And Deborah L Dietich Living and Dietrich
Purchase Details
Closed on
Sep 29, 2021
Sold by
Brubaker Randall R
Bought by
Dietrich John W and Dietrich Deborah L
Purchase Details
Closed on
Apr 24, 2019
Sold by
Bolton Michael B and Bolton Danette M
Bought by
Brubaker Randall R
Home Financials for this Owner
Home Financials are based on the most recent Mortgage that was taken out on this home.
Original Mortgage
$184,000
Interest Rate
4.25%
Mortgage Type
New Conventional
Create a Home Valuation Report for This Property
The Home Valuation Report is an in-depth analysis detailing your home's value as well as a comparison with similar homes in the area
Home Values in the Area
Average Home Value in this Area
Purchase History
| Date | Buyer | Sale Price | Title Company |
|---|---|---|---|
| Boldt Lance E | -- | None Listed On Document | |
| John W Dietrich And Deborah L Dietich Living | -- | None Listed On Document | |
| Dietrich John W | $265,000 | None Available | |
| Brubaker Randall R | $230,000 | Quad County Title |
Source: Public Records
Mortgage History
| Date | Status | Borrower | Loan Amount |
|---|---|---|---|
| Open | Boldt Lance E | $341,525 | |
| Previous Owner | Brubaker Randall R | $184,000 |
Source: Public Records
Tax History Compared to Growth
Tax History
| Year | Tax Paid | Tax Assessment Tax Assessment Total Assessment is a certain percentage of the fair market value that is determined by local assessors to be the total taxable value of land and additions on the property. | Land | Improvement |
|---|---|---|---|---|
| 2024 | $6,793 | $98,190 | $8,470 | $89,720 |
| 2023 | $6,791 | $91,770 | $7,920 | $83,850 |
| 2022 | $6,546 | $83,430 | $7,200 | $76,230 |
| 2021 | $5,636 | $77,970 | $6,730 | $71,240 |
| 2020 | $5,610 | $77,370 | $6,670 | $70,700 |
| 2019 | $6,192 | $74,540 | $6,430 | $68,110 |
| 2018 | $6,206 | $74,540 | $6,430 | $68,110 |
| 2017 | $5,888 | $70,360 | $6,300 | $64,060 |
| 2016 | $5,779 | $66,370 | $5,940 | $60,430 |
| 2015 | $55 | $66,370 | $5,940 | $60,430 |
| 2012 | $55 | $66,330 | $7,090 | $59,240 |
Source: Public Records
Map
Nearby Homes
- 1201 N Franklin St
- 317 Northwood Ln
- 111 Hawthorn Rd
- 321 W Boone St
- 731 W Boone St
- 102 Lost Hollow Dr
- 823 N College St
- 214 Northwood Ln
- 727 N Broadway Ave
- 1133 W Boone St
- 145 Hickory Grove Ln
- 620 N College St
- 805 N Reel Ave
- 524 N Broadway Ave
- 441 N Ohio Ave
- 621 Oglesby St
- 104 Hickory Grove Ln
- 518 Roddy Rd
- 1413 W Spruce St
- 515 N Marion St
- 388 N Pointe Dr
- 388 N Point Rd
- 386 N Pointe Dr
- 386 N Point Rd
- 390 N Pointe Dr
- 390 N Point Rd
- 000 N Pointe Dr
- 0 N Pointe Dr
- 402 Greenbriar Dr
- 392 N Point Rd
- 7 Greenbriar Ln
- 401 Mayfair Ln
- 404 Greenbriar Dr
- 404 Greenbriar Ln
- 403 Greenbriar Dr
- 403 Mayfair Ln
- 402 Mayfair Ln
- 00 Greenbriar
- 406 Greenbriar Dr
- 1 Northpoint Dr