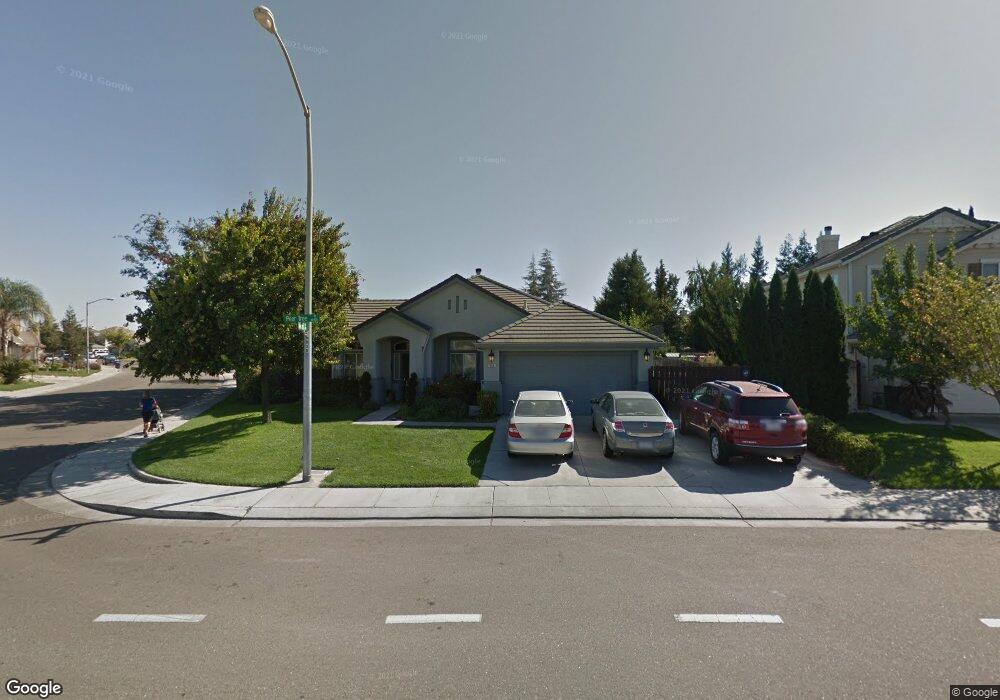
388 Pear Tree St Manteca, CA 95337
Estimated Value: $562,000 - $604,000
About This Home
This home is located at 388 Pear Tree St, Manteca, CA 95337 and is currently estimated at $591,014, approximately $321 per square foot. 388 Pear Tree St is a home located in San Joaquin County with nearby schools including Walter Woodward Elementary School and Manteca High School.
Ownership History
We collect this data history from publicly available records. To have your information removed, we recommend requesting removal directly through your county’s website.
Purchase Details
Home Financials for this Owner
Home Financials are based on the most recent Mortgage that was taken out on this home.Purchase History
We collect this data history from publicly available records. To have your information removed, we recommend requesting removal directly through your county’s website.
| Date | Buyer | Sale Price | Title Company |
|---|---|---|---|
| $180,000 | Central Valley Title Company |
Mortgage History
We collect this data history from publicly available records. To have your information removed, we recommend requesting removal directly through your county’s website.
| Date | Status | Borrower | Loan Amount |
|---|---|---|---|
| Open | $143,650 |
Tax History
We collect this data history from publicly available records. To have your information removed, we recommend requesting removal directly through your county’s website.
| Year | Tax Paid | Tax Assessment Tax Assessment Total Assessment is a certain percentage of the fair market value that is determined by local assessors to be the total taxable value of land and additions on the property. | Land | Improvement |
|---|---|---|---|---|
| 2025 | $3,854 | $296,879 | $86,216 | $210,663 |
| 2024 | $3,762 | $291,059 | $84,526 | $206,533 |
| 2023 | $3,722 | $285,353 | $82,869 | $202,484 |
| 2022 | $3,670 | $279,759 | $81,245 | $198,514 |
| 2021 | $3,634 | $274,274 | $79,652 | $194,622 |
| 2020 | $3,510 | $271,463 | $78,836 | $192,627 |
| 2019 | $3,469 | $266,141 | $77,291 | $188,850 |
| 2018 | $3,425 | $260,924 | $75,776 | $185,148 |
| 2017 | $3,390 | $255,809 | $74,291 | $181,518 |
| 2016 | $3,330 | $250,793 | $72,834 | $177,959 |
| 2014 | $3,143 | $242,188 | $70,335 | $171,853 |
Map
- 2135 Fountain Square Ave
- 2187 Fountain Square Ave
- 175 Feverfew St
- 1471 Tanoak St
- 2354 Ruthie Ave
- 131 Legacy St
- 119 Legacy St
- 2232 Katherine Place
- 2371 Cornwall Ave
- 763 Grafton St
- 864 Grafton St
- 655 Mono St
- 2317 Mathar Dr
- 258 Columbus Dr
- 1044 Jasmine Hollow Dr
- 943 Tannehill Dr
- 1773 Lana Way
- 2408 Dilip Dr
- 2466 Paramount Ln
- 2394 Bharvani Ave
- 368 Pear Tree St
- 2011 Woodbine Ave
- 2025 Woodbine Ave
- 471 Heartland Dr
- 346 Pear Tree St
- 373 Pear Tree St
- 477 Heartland Dr
- 2037 Woodbine Ave
- 459 Heartland Dr
- 347 Pear Tree St
- 483 Heartland Dr
- 1916 Belmont Place
- 2049 Woodbine Ave
- 1930 Belmont Place
- 1905 Buena Vista Dr
- 2012 Woodbine Ave
- 452 Heartland Dr
- 453 Heartland Dr
- 1944 Belmont Place
- 1892 Belmont Place
Ask me questions while you tour the home.