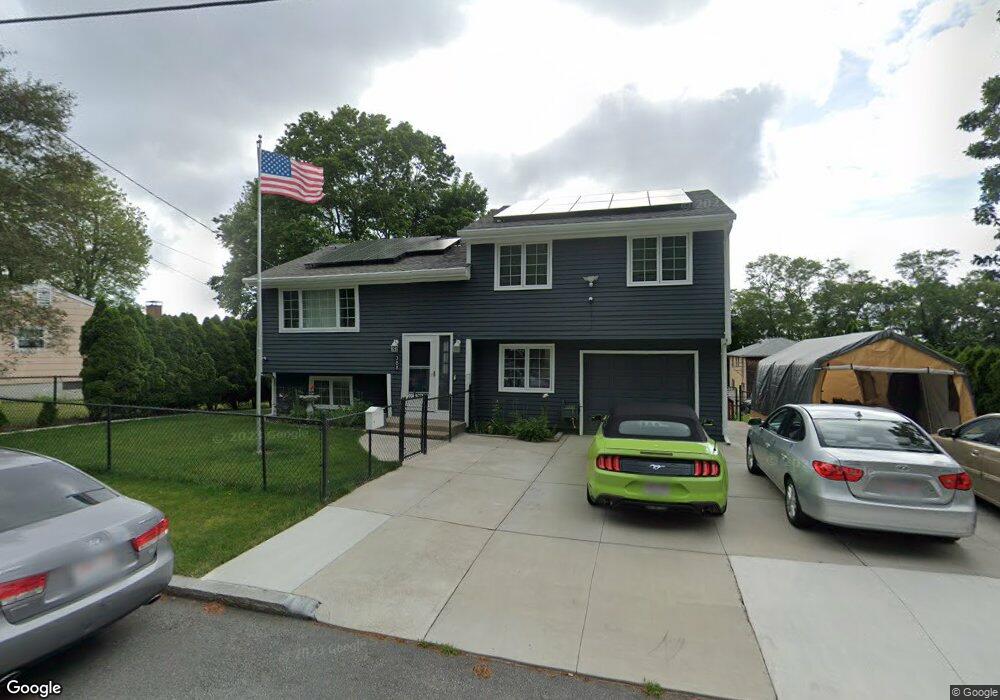
388 Quincy St Fall River, MA 02720
Western Fall River NeighborhoodEstimated Value: $442,000 - $482,180
3
Beds
2
Baths
1,798
Sq Ft
$257/Sq Ft
Est. Value
About This Home
This home is located at 388 Quincy St, Fall River, MA 02720 and is currently estimated at $462,545, approximately $257 per square foot. 388 Quincy St is a home located in Bristol County with nearby schools including North End Elementary School, Morton Middle School, and B M C Durfee High School.
Ownership History
Date
Name
Owned For
Owner Type
Purchase Details
Closed on
Jul 7, 2017
Sold by
Mota Michael
Bought by
Mota Michael and Mccormack Lisa M
Current Estimated Value
Purchase Details
Closed on
Oct 29, 2007
Sold by
Deutsche Bank Natl T C
Bought by
Mota Michael
Home Financials for this Owner
Home Financials are based on the most recent Mortgage that was taken out on this home.
Original Mortgage
$210,000
Interest Rate
6.39%
Mortgage Type
Purchase Money Mortgage
Purchase Details
Closed on
Jul 23, 2007
Sold by
Crumley Laurie A
Bought by
Deutsche Bank Natl T C
Purchase Details
Closed on
Nov 1, 2002
Sold by
Webb Jason
Bought by
Crumley Roy M and Crumley Laurie A
Purchase Details
Closed on
Sep 25, 2000
Sold by
Lavoie Donald G
Bought by
Webb Jason
Purchase Details
Closed on
Mar 30, 1999
Sold by
Ferreira Amilcar A and Ferreira Maria F
Bought by
Lavoie Donald G
Create a Home Valuation Report for This Property
The Home Valuation Report is an in-depth analysis detailing your home's value as well as a comparison with similar homes in the area
Home Values in the Area
Average Home Value in this Area
Purchase History
| Date | Buyer | Sale Price | Title Company |
|---|---|---|---|
| Mota Michael | -- | -- | |
| Mota Michael | $210,000 | -- | |
| Deutsche Bank Natl T C | $237,742 | -- | |
| Crumley Roy M | $193,900 | -- | |
| Webb Jason | $125,000 | -- | |
| Lavoie Donald G | $136,000 | -- |
Source: Public Records
Mortgage History
| Date | Status | Borrower | Loan Amount |
|---|---|---|---|
| Previous Owner | Lavoie Donald G | $207,833 | |
| Previous Owner | Mota Michael | $210,000 |
Source: Public Records
Tax History
| Year | Tax Paid | Tax Assessment Tax Assessment Total Assessment is a certain percentage of the fair market value that is determined by local assessors to be the total taxable value of land and additions on the property. | Land | Improvement |
|---|---|---|---|---|
| 2025 | $4,177 | $364,800 | $117,300 | $247,500 |
| 2024 | $3,774 | $328,500 | $115,000 | $213,500 |
| 2023 | $3,681 | $300,000 | $103,600 | $196,400 |
| 2022 | $3,253 | $257,800 | $97,800 | $160,000 |
| 2021 | $3,210 | $232,100 | $93,400 | $138,700 |
| 2020 | $3,128 | $216,500 | $89,100 | $127,400 |
| 2019 | $2,910 | $199,600 | $93,200 | $106,400 |
| 2018 | $2,924 | $200,000 | $93,800 | $106,200 |
| 2017 | $2,800 | $200,000 | $93,800 | $106,200 |
| 2016 | $2,752 | $201,900 | $96,700 | $105,200 |
| 2015 | $2,590 | $198,000 | $96,700 | $101,300 |
| 2014 | $2,491 | $198,000 | $96,700 | $101,300 |
Source: Public Records
Map
Nearby Homes
- 33 Warner St
- 257 Calvin St
- 1810 Highland Ave Unit 22
- Parcel 2 Highcrest Rd
- 29 Valentine St
- 318 Crescent St Unit A
- 274 Archer St
- 195 Crescent St Unit 3
- 108 Stowe St Unit 108
- 3636 N Main St Unit 5
- 247 Albany St
- 230 College Park Rd
- 201 Montgomery Cir
- 72 Ida Ln
- 2106 Meridian St
- 333 Langley St
- 210 Harrison Ave
- 1553 Riverside Ave
- 17 Langley St
- 208 Florence St
- 15 Fieldstone Ln
- 15 Fieldstone Ln Unit ANR 8
- 362 Quincy St
- 147 Haskell St
- 151 Haskell St
- 139 Haskell St
- 139 Haskell St Unit 1
- 129 Haskell St
- 377 Quincy St
- 405 Quincy St
- 119 Warner St
- 350 Quincy St
- 351 Quincy St
- 105 Warner St
- 213 Haskell St
- 332 Quincy St
- 140 Haskell St
- 150 Haskell St
- 327 Quincy St
- 166 Haskell St
Your Personal Tour Guide
Ask me questions while you tour the home.