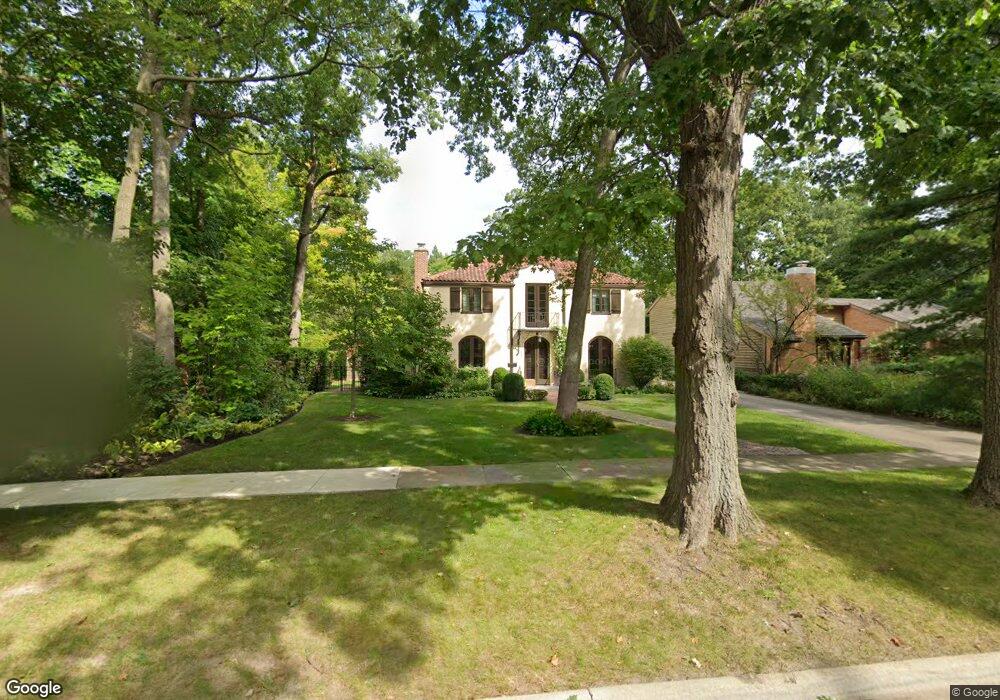
388 Ravine Park Dr Lake Forest, IL 60045
Estimated Value: $1,655,858 - $1,910,000
5
Beds
5
Baths
4,000
Sq Ft
$442/Sq Ft
Est. Value
About This Home
This home is located at 388 Ravine Park Dr, Lake Forest, IL 60045 and is currently estimated at $1,769,215, approximately $442 per square foot. 388 Ravine Park Dr is a home located in Lake County with nearby schools including Sheridan Elementary School, Deer Path Middle School East, and Lake Forest High School.
Ownership History
Date
Name
Owned For
Owner Type
Purchase Details
Closed on
May 17, 2007
Sold by
Schumacher Brad H and Thomason Carol P
Bought by
Matkov Thomas G and Whisler Laura C
Current Estimated Value
Home Financials for this Owner
Home Financials are based on the most recent Mortgage that was taken out on this home.
Original Mortgage
$1,100,000
Outstanding Balance
$670,191
Interest Rate
6.2%
Mortgage Type
Purchase Money Mortgage
Estimated Equity
$1,099,024
Purchase Details
Closed on
Jun 15, 2004
Sold by
Brand Richard L and Brand Paula J
Bought by
Schumacher Brad H and Thomason Carol P
Home Financials for this Owner
Home Financials are based on the most recent Mortgage that was taken out on this home.
Original Mortgage
$647,500
Interest Rate
5.62%
Mortgage Type
Purchase Money Mortgage
Create a Home Valuation Report for This Property
The Home Valuation Report is an in-depth analysis detailing your home's value as well as a comparison with similar homes in the area
Home Values in the Area
Average Home Value in this Area
Purchase History
| Date | Buyer | Sale Price | Title Company |
|---|---|---|---|
| Matkov Thomas G | $1,525,000 | Chicago Title Insurance Co | |
| Schumacher Brad H | $925,000 | Chicago Title Insurance Comp |
Source: Public Records
Mortgage History
| Date | Status | Borrower | Loan Amount |
|---|---|---|---|
| Open | Matkov Thomas G | $1,100,000 | |
| Previous Owner | Schumacher Brad H | $647,500 | |
| Closed | Schumacher Brad H | $231,250 |
Source: Public Records
Tax History Compared to Growth
Tax History
| Year | Tax Paid | Tax Assessment Tax Assessment Total Assessment is a certain percentage of the fair market value that is determined by local assessors to be the total taxable value of land and additions on the property. | Land | Improvement |
|---|---|---|---|---|
| 2024 | $24,139 | $397,727 | $162,199 | $235,528 |
| 2023 | $24,139 | $391,556 | $135,927 | $255,629 |
| 2022 | $22,605 | $380,379 | $132,047 | $248,332 |
| 2021 | $21,976 | $377,098 | $130,908 | $246,190 |
| 2020 | $21,484 | $379,184 | $131,632 | $247,552 |
| 2019 | $20,411 | $372,224 | $129,216 | $243,008 |
| 2018 | $11,962 | $424,119 | $172,332 | $251,787 |
| 2017 | $21,430 | $417,029 | $169,451 | $247,578 |
| 2016 | $20,550 | $396,944 | $161,290 | $235,654 |
| 2015 | $20,315 | $373,770 | $151,874 | $221,896 |
| 2014 | $18,302 | $335,728 | $136,351 | $199,377 |
| 2012 | $17,943 | $338,641 | $137,534 | $201,107 |
Source: Public Records
Map
Nearby Homes
- 246 Park Ave
- 166 Park Ave
- 145 Moffett Rd
- 131 Moffett Rd
- 321 Newman Ct
- 1301 N Western Ave Unit 134
- 1301 N Western Ave Unit 335
- 700 Forest Cove Rd
- 1230 N Western Ave Unit 301
- 546 Lakeland Dr
- 788 E Woodland Rd
- 1271 N Green Bay Rd
- 111 E Laurel Ave Unit THI
- 119 E Laurel Ave Unit 207
- 701 E Center Ave
- 1302 N Green Bay Rd
- 120 E Scranton Ave Unit 202
- 120 E Scranton Ave Unit 203
- 120 E Scranton Ave Unit 201
- 120 E Scranton Ave Unit 102
- 394 Ravine Park Dr
- 382 Ravine Park Dr
- 408 Ravine Park Dr
- 391 Ravine Park Dr
- 345 E Sheridan Rd
- 333 E Sheridan Rd
- 405 E Sheridan Rd
- 371 Ravine Park Dr
- 1575 Willow St
- 420 Ravine Park Dr
- 1590 N Sheridan Rd
- 1585 Willow St
- 415 E Sheridan Rd
- 364 Ravine Park Dr
- 315 E Sheridan Rd
- 1550 N Sheridan Rd
- 365 Ravine Park Dr
- 1565 Willow St
- 1555 Willow St
- 332 E Sheridan Rd