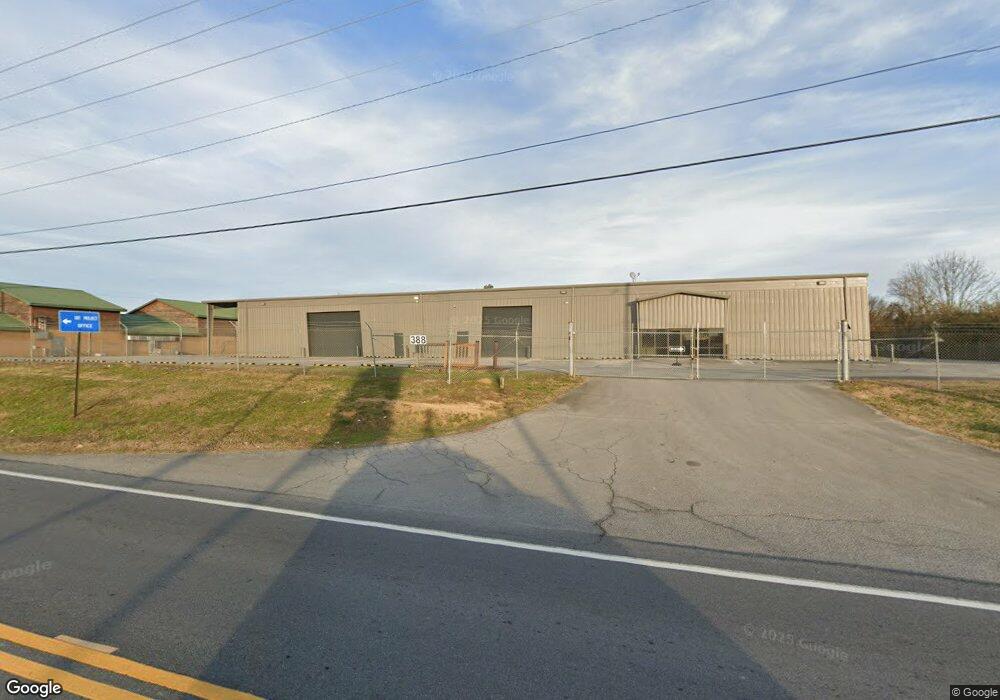
388 Richardson Rd SE Calhoun, GA 30701
Estimated Value: $1,875,786
--
Bed
--
Bath
20,140
Sq Ft
$93/Sq Ft
Est. Value
About This Home
This home is located at 388 Richardson Rd SE, Calhoun, GA 30701 and is currently estimated at $1,875,786, approximately $93 per square foot. 388 Richardson Rd SE is a home located in Gordon County with nearby schools including Calhoun Primary School, Calhoun Elementary School, and Calhoun Middle School.
Ownership History
Date
Name
Owned For
Owner Type
Purchase Details
Closed on
Sep 8, 2021
Sold by
312 Land Co Llc
Bought by
Thurlow Industries Llc
Current Estimated Value
Purchase Details
Closed on
Jun 30, 2017
Bought by
312 Land Co Llc
Home Financials for this Owner
Home Financials are based on the most recent Mortgage that was taken out on this home.
Original Mortgage
$695,000
Interest Rate
3.94%
Mortgage Type
Commercial
Purchase Details
Closed on
Jun 8, 2007
Sold by
Hendricks Commercial Prope
Bought by
312 Land Co Llc
Purchase Details
Closed on
Apr 16, 2007
Sold by
Hendricks Commercial Properties Llc
Bought by
Hendricks Commercial Properties Llc
Purchase Details
Closed on
Jul 19, 2006
Sold by
Pieres Hardy Ltd Partnership
Bought by
Hendrix Commercial Properties Llc
Purchase Details
Closed on
Sep 23, 1999
Bought by
Pieres Hardy Ltd Partnership
Create a Home Valuation Report for This Property
The Home Valuation Report is an in-depth analysis detailing your home's value as well as a comparison with similar homes in the area
Home Values in the Area
Average Home Value in this Area
Purchase History
| Date | Buyer | Sale Price | Title Company |
|---|---|---|---|
| Thurlow Industries Llc | $1,460,000 | -- | |
| 312 Land Co Llc | $845,000 | -- | |
| 312 Land Co Llc | $150,000 | -- | |
| Hendricks Commercial Properties Llc | -- | -- | |
| Hendrix Commercial Properties Llc | $1,325,000 | -- | |
| Hendricks Commercial Propertie | $1,325,000 | -- | |
| Pieres Hardy Ltd Partnership | $360,000 | -- |
Source: Public Records
Mortgage History
| Date | Status | Borrower | Loan Amount |
|---|---|---|---|
| Previous Owner | 312 Land Co Llc | $695,000 |
Source: Public Records
Tax History Compared to Growth
Tax History
| Year | Tax Paid | Tax Assessment Tax Assessment Total Assessment is a certain percentage of the fair market value that is determined by local assessors to be the total taxable value of land and additions on the property. | Land | Improvement |
|---|---|---|---|---|
| 2024 | $8,553 | $304,200 | $129,640 | $174,560 |
| 2023 | $8,762 | $311,640 | $129,640 | $182,000 |
| 2022 | $2,829 | $297,320 | $129,640 | $167,680 |
| 2021 | $9,192 | $308,760 | $129,640 | $179,120 |
| 2020 | $9,402 | $313,320 | $129,640 | $183,680 |
| 2019 | $9,887 | $313,320 | $129,640 | $183,680 |
| 2018 | $3,255 | $518,552 | $259,280 | $259,272 |
| 2016 | $5,109 | $518,552 | $259,280 | $259,272 |
| 2015 | $5,175 | $518,552 | $259,280 | $259,272 |
| 2014 | $5,108 | $518,760 | $259,280 | $259,480 |
Source: Public Records
Map
Nearby Homes
- 201 Porch Loop SE
- 0 Richardson Rd SE Unit 10474273
- 0 Richardson Rd SE Unit 7537183
- 220 Porch Loop SE
- 0 Lovers Lane Rd SE Unit 10509663
- 00 Curtis Cir
- 1401 U S 41
- 111 Lewis Dr SE
- 271 Old Belwood Rd SE
- 1311 Us Highway 41
- 306 E Belmont Dr
- 0 Curtis Cir SE Unit 10611011
- 0 Curtis Cir SE Unit 7654260
- 102 Sylvania Cir
- 0 W Belmont Dr Unit 10489910
- 133 Kensington Dr SE
- 252 Blackwood Place SE
- 106 Kensington Dr SE
- 199 Cherry St SE
- 402 Linda Ln
- 380 Richardson Rd SE
- 377 Richardson Rd SE Unit SUITE 5
- 377 Richardson Rd SE Unit SUITE 2
- 377 Richardson Rd SE Unit Suites 2 & 5
- 377 Richardson Rd SE
- 367 Richardson Rd SE
- 355 Richardson Rd SE Unit 7
- 355 Richardson Rd SE
- 645 Highway 53 East SE
- 460 Richardson Rd SE
- 645 Highway 53
- 349 Richardson Rd SE
- 317 Richardson Rd SE
- 0 Porch Loop SE Unit 7556054
- 0 Porch Loop SE Unit 8316835
- 0 Porch Loop SE Unit 7049747
- 239 Stone Loop
- 536 Highway 53 E
- 161 Porch Loop SE
- 767 Highway 53 East SE