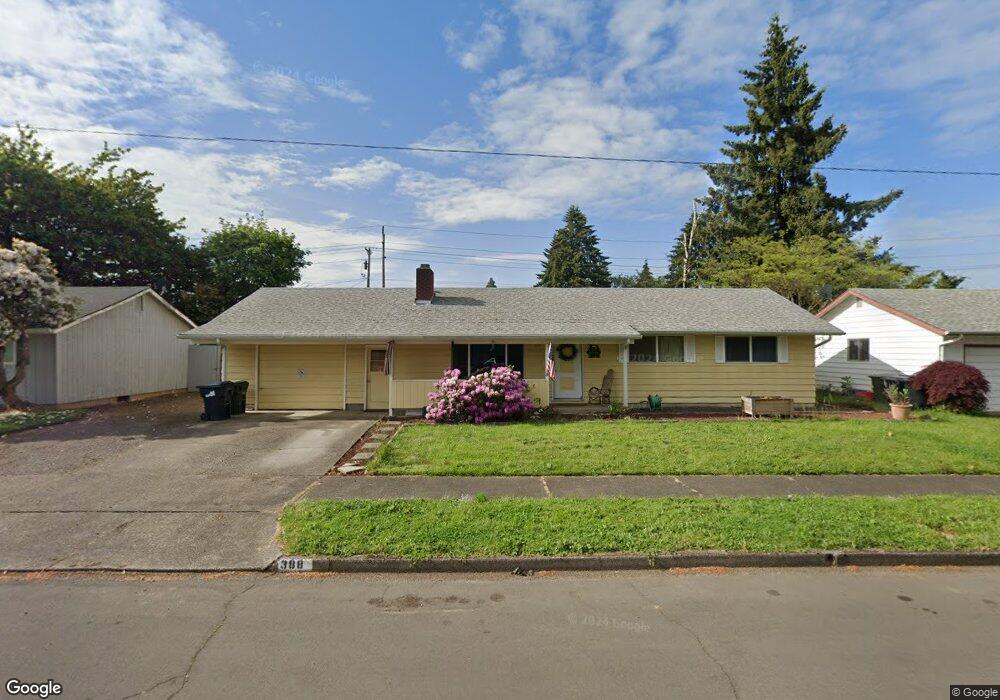
388 Ruby Ave Eugene, OR 97404
Santa Clara NeighborhoodEstimated Value: $397,000 - $410,000
3
Beds
2
Baths
1,408
Sq Ft
$286/Sq Ft
Est. Value
About This Home
This home is located at 388 Ruby Ave, Eugene, OR 97404 and is currently estimated at $402,098, approximately $285 per square foot. 388 Ruby Ave is a home located in Lane County with nearby schools including Spring Creek Elementary School, Madison Middle School, and North Eugene High School.
Ownership History
Date
Name
Owned For
Owner Type
Purchase Details
Closed on
Jan 10, 2025
Sold by
Ross John H
Bought by
Ross John H and Ross Echo J
Current Estimated Value
Purchase Details
Closed on
Aug 7, 2019
Sold by
Ross John H
Bought by
Ross John H and Ross Marybeth
Home Financials for this Owner
Home Financials are based on the most recent Mortgage that was taken out on this home.
Original Mortgage
$190,000
Interest Rate
3.73%
Mortgage Type
New Conventional
Purchase Details
Closed on
Mar 30, 2018
Sold by
Ross Bruce A and Estate Of Bruce A Ross
Bought by
Ross John H and Ross Marybeth
Home Financials for this Owner
Home Financials are based on the most recent Mortgage that was taken out on this home.
Original Mortgage
$176,905
Interest Rate
4.38%
Mortgage Type
New Conventional
Create a Home Valuation Report for This Property
The Home Valuation Report is an in-depth analysis detailing your home's value as well as a comparison with similar homes in the area
Home Values in the Area
Average Home Value in this Area
Purchase History
| Date | Buyer | Sale Price | Title Company |
|---|---|---|---|
| Ross John H | -- | None Listed On Document | |
| Ross John H | -- | Cascade Title Company | |
| Ross John H | -- | Cascade Title Co | |
| Ross John H | $182,377 | Cascade Title |
Source: Public Records
Mortgage History
| Date | Status | Borrower | Loan Amount |
|---|---|---|---|
| Previous Owner | Ross John H | $190,000 | |
| Previous Owner | Ross John H | $176,905 |
Source: Public Records
Tax History
| Year | Tax Paid | Tax Assessment Tax Assessment Total Assessment is a certain percentage of the fair market value that is determined by local assessors to be the total taxable value of land and additions on the property. | Land | Improvement |
|---|---|---|---|---|
| 2025 | $2,394 | $187,050 | -- | -- |
| 2024 | $2,382 | $181,602 | -- | -- |
| 2023 | $2,382 | $176,313 | -- | -- |
| 2022 | $2,238 | $171,178 | $0 | $0 |
| 2021 | $2,054 | $166,193 | $0 | $0 |
| 2020 | $2,092 | $161,353 | $0 | $0 |
| 2019 | $2,015 | $156,654 | $0 | $0 |
| 2018 | $1,855 | $147,662 | $0 | $0 |
| 2017 | $1,782 | $147,662 | $0 | $0 |
| 2016 | $1,675 | $143,361 | $0 | $0 |
| 2015 | $1,603 | $139,185 | $0 | $0 |
| 2014 | $1,500 | $135,131 | $0 | $0 |
Source: Public Records
Map
Nearby Homes
- 541 Durham Ave
- 303 Lenore Loop
- 401 Sterling Dr
- 2563 York St
- 2439 Quince St
- 193 Santa Clara Ave
- 215 Jonquil Ave
- 349 Irving Rd
- 2721 La Darrah St
- 200 Irving Rd
- 1755 Brentwood Ave
- 805 Impala Ave
- 1880 Manihi Dr
- 1682 Hemlock St
- 2488 Northampton
- 1566 Maywood Ave
- 1307 Bramblewood Ln
- 389 Maxwell Rd
- 190 Hunsaker Ln
- 2640 Green Villa Ln
Your Personal Tour Guide
Ask me questions while you tour the home.