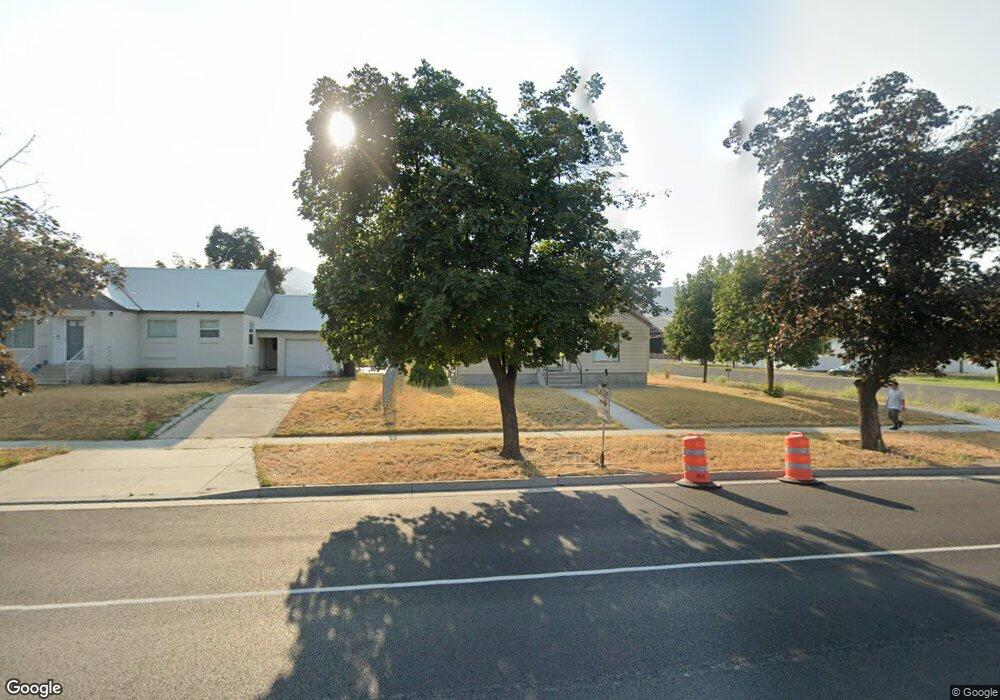
388 S Main St Smithfield, UT 84335
Estimated Value: $334,000 - $375,891
2
Beds
1
Bath
1,774
Sq Ft
$201/Sq Ft
Est. Value
About This Home
This home is located at 388 S Main St, Smithfield, UT 84335 and is currently estimated at $356,473, approximately $200 per square foot. 388 S Main St is a home located in Cache County with nearby schools including Summit School, Cedar Ridge School, and North Cache Middle School.
Ownership History
Date
Name
Owned For
Owner Type
Purchase Details
Closed on
Mar 15, 2023
Sold by
Charles And Penny Findlay Family Trust
Bought by
Price Kristoffer
Current Estimated Value
Home Financials for this Owner
Home Financials are based on the most recent Mortgage that was taken out on this home.
Original Mortgage
$359,000
Outstanding Balance
$346,828
Interest Rate
6.09%
Mortgage Type
VA
Estimated Equity
$9,645
Purchase Details
Closed on
Sep 7, 2022
Sold by
Findlay Charles R and Findlay Penny H
Bought by
Charles And Peny Findlay Family Trust
Home Financials for this Owner
Home Financials are based on the most recent Mortgage that was taken out on this home.
Original Mortgage
$465,000
Interest Rate
5.89%
Purchase Details
Closed on
Dec 29, 2017
Sold by
Findlay Charles R and Findlay Penny H
Bought by
Findlay Charles R and Findlay Penny H
Create a Home Valuation Report for This Property
The Home Valuation Report is an in-depth analysis detailing your home's value as well as a comparison with similar homes in the area
Home Values in the Area
Average Home Value in this Area
Purchase History
| Date | Buyer | Sale Price | Title Company |
|---|---|---|---|
| Price Kristoffer | -- | Cache Title | |
| Charles And Peny Findlay Family Trust | -- | Northern Title | |
| Findlay Charles R | -- | Northern Title | |
| Findlay Charles R | -- | -- |
Source: Public Records
Mortgage History
| Date | Status | Borrower | Loan Amount |
|---|---|---|---|
| Open | Price Kristoffer | $359,000 | |
| Previous Owner | Findlay Charles R | $465,000 | |
| Previous Owner | Findlay Charles R | $465,000 |
Source: Public Records
Tax History
| Year | Tax Paid | Tax Assessment Tax Assessment Total Assessment is a certain percentage of the fair market value that is determined by local assessors to be the total taxable value of land and additions on the property. | Land | Improvement |
|---|---|---|---|---|
| 2025 | $1,250 | $167,285 | $0 | $0 |
| 2024 | $1,395 | $175,245 | $0 | $0 |
| 2023 | $1,479 | $175,670 | $0 | $0 |
| 2022 | $1,408 | $164,520 | $0 | $0 |
| 2021 | $1,340 | $239,210 | $68,000 | $171,210 |
| 2020 | $1,199 | $199,700 | $68,000 | $131,700 |
| 2019 | $1,104 | $175,300 | $43,600 | $131,700 |
| 2018 | $892 | $137,008 | $43,600 | $93,408 |
| 2017 | $833 | $69,850 | $0 | $0 |
| 2016 | $847 | $69,850 | $0 | $0 |
| 2015 | $851 | $69,850 | $0 | $0 |
| 2014 | $834 | $69,850 | $0 | $0 |
| 2013 | -- | $68,540 | $0 | $0 |
Source: Public Records
Map
Nearby Homes
Your Personal Tour Guide
Ask me questions while you tour the home.