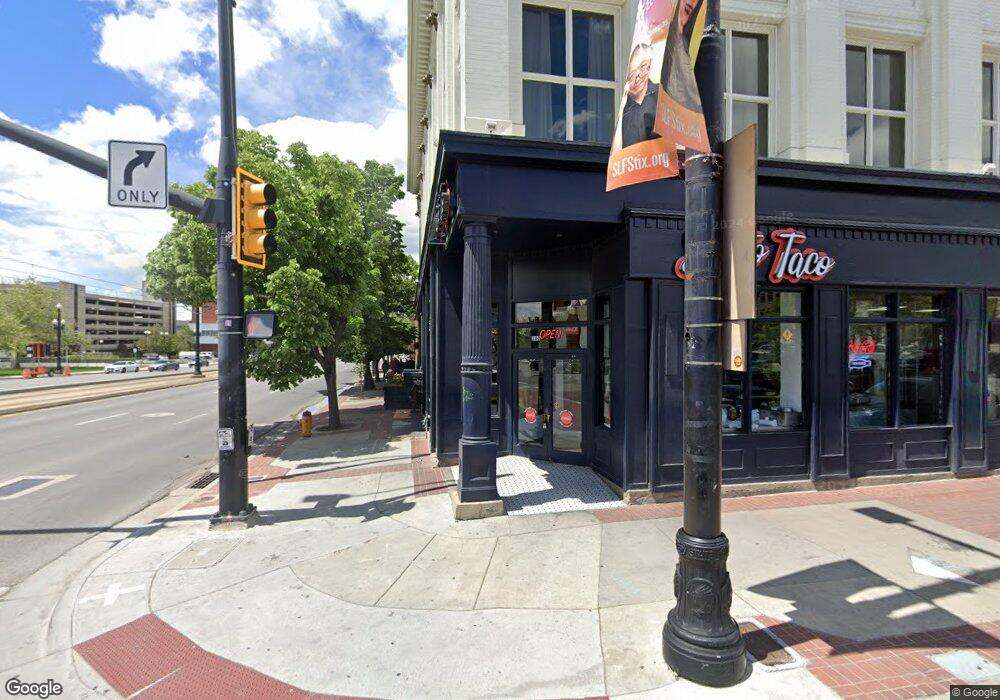
388 S State St Unit NG Salt Lake City, UT 84111
The Avenues NeighborhoodEstimated Value: $680,026 - $763,000
3
Beds
2
Baths
1,151
Sq Ft
$625/Sq Ft
Est. Value
About This Home
This home is located at 388 S State St Unit NG, Salt Lake City, UT 84111 and is currently estimated at $719,507, approximately $625 per square foot. 388 S State St Unit NG is a home located in Salt Lake County with nearby schools including Ensign School, West High, and Open Classroom.
Ownership History
Date
Name
Owned For
Owner Type
Purchase Details
Closed on
May 23, 2003
Sold by
Bitter Paul R and Menconi Susan M
Bought by
Bitter Paul R and Menconi Susan M
Current Estimated Value
Home Financials for this Owner
Home Financials are based on the most recent Mortgage that was taken out on this home.
Original Mortgage
$90,000
Outstanding Balance
$35,054
Interest Rate
4.37%
Mortgage Type
Purchase Money Mortgage
Estimated Equity
$684,453
Purchase Details
Closed on
May 22, 1998
Sold by
Paul R Bitter & Susan M Menconi Family T
Bought by
Bitter Paul Richard and Menconi Susan Marie
Home Financials for this Owner
Home Financials are based on the most recent Mortgage that was taken out on this home.
Original Mortgage
$115,300
Interest Rate
7.13%
Create a Home Valuation Report for This Property
The Home Valuation Report is an in-depth analysis detailing your home's value as well as a comparison with similar homes in the area
Home Values in the Area
Average Home Value in this Area
Purchase History
| Date | Buyer | Sale Price | Title Company |
|---|---|---|---|
| Bitter Paul R | -- | First American Title | |
| Bitter Paul R | -- | First American Title | |
| Bitter Paul Richard | -- | -- |
Source: Public Records
Mortgage History
| Date | Status | Borrower | Loan Amount |
|---|---|---|---|
| Open | Bitter Paul R | $90,000 | |
| Closed | Bitter Paul Richard | $115,300 |
Source: Public Records
Tax History Compared to Growth
Tax History
| Year | Tax Paid | Tax Assessment Tax Assessment Total Assessment is a certain percentage of the fair market value that is determined by local assessors to be the total taxable value of land and additions on the property. | Land | Improvement |
|---|---|---|---|---|
| 2025 | $3,092 | $693,300 | $251,200 | $442,100 |
| 2024 | $3,092 | $590,000 | $239,800 | $350,200 |
| 2023 | $3,050 | $561,000 | $230,600 | $330,400 |
| 2022 | $3,351 | $578,200 | $177,800 | $400,400 |
| 2021 | $2,977 | $465,100 | $144,300 | $320,800 |
| 2020 | $2,937 | $436,800 | $134,800 | $302,000 |
| 2019 | $2,471 | $345,700 | $126,300 | $219,400 |
| 2018 | $2,477 | $337,500 | $126,300 | $211,200 |
| 2017 | $2,488 | $317,500 | $126,300 | $191,200 |
| 2016 | $2,360 | $286,000 | $120,300 | $165,700 |
| 2015 | $2,388 | $274,400 | $111,200 | $163,200 |
| 2014 | $2,509 | $285,900 | $116,800 | $169,100 |
Source: Public Records
Map
Nearby Homes